Price of Brazil's Nucleic Acids Decreases to $37.6 per kg
Brazil Nucleic Acids Import Price in June 2023
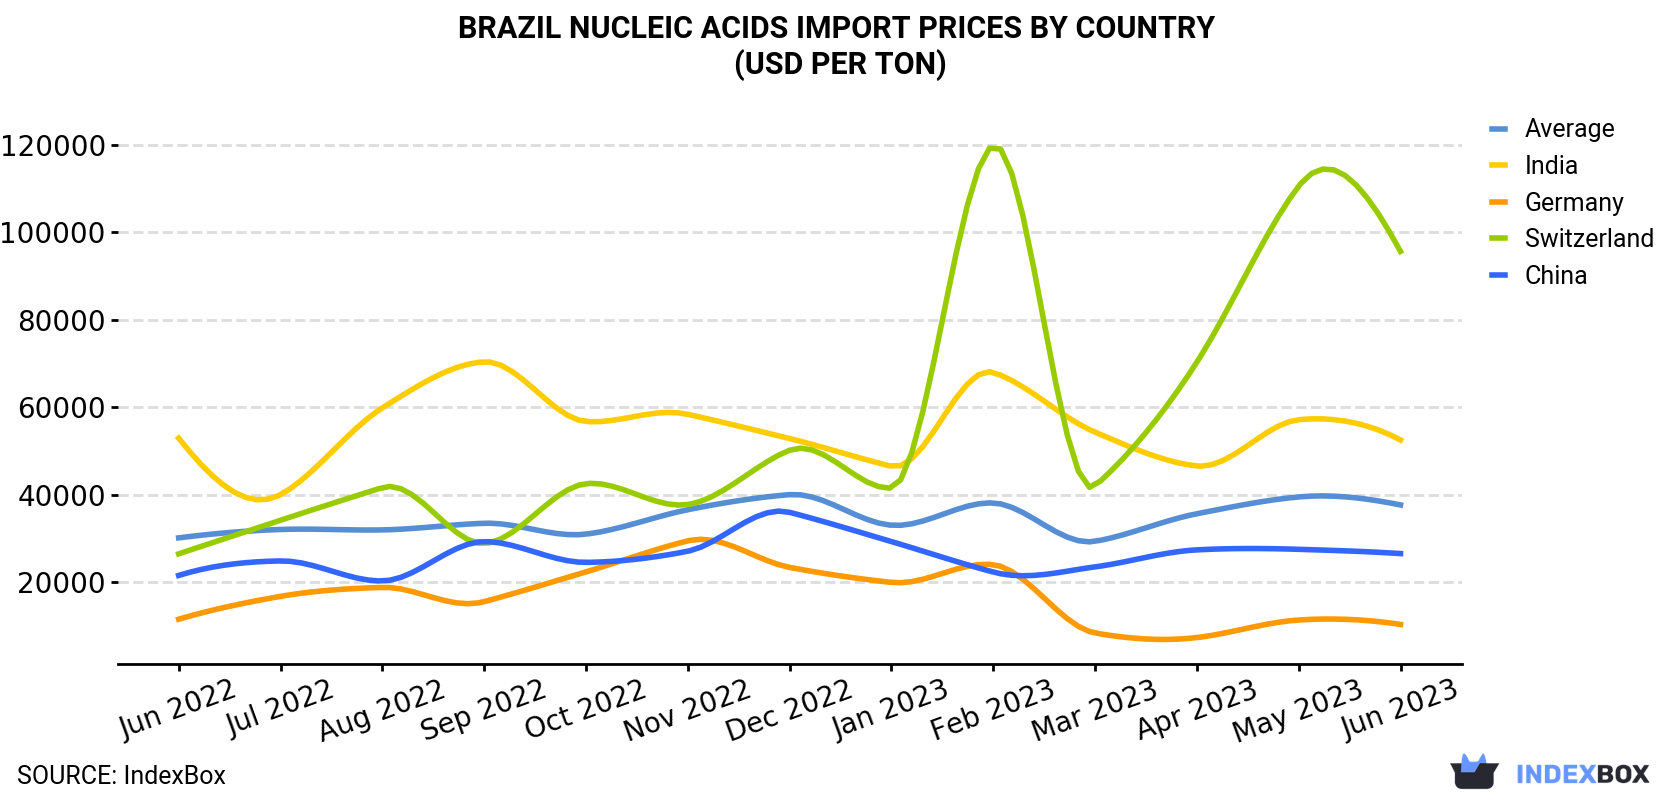
In June 2023, the nucleic acids price amounted to $37,619 per ton (CIF, Brazil), dropping by -4.6% against the previous month. Over the last twelve-month period, it increased at an average monthly rate of +1.9%. The growth pace was the most rapid in April 2023 an increase of 22% m-o-m. The import price peaked at $39,978 per ton in December 2022; however, from January 2023 to June 2023, import prices remained at a lower figure.
There were significant differences in the average prices amongst the major supplying countries. In June 2023, the country with the highest price was Switzerland ($95,663 per ton), while the price for Germany ($10,263 per ton) was amongst the lowest.
From June 2022 to June 2023, the most notable rate of growth in terms of prices was attained by Switzerland (+11.3%), while the prices for the other major suppliers experienced mixed trend patterns.
| COUNTRY | Import Price of Nucleic Acids in Brazil (USD per ton) | ||||||||||||
|---|---|---|---|---|---|---|---|---|---|---|---|---|---|
| Jun 2022 | Jul 2022 | Aug 2022 | Sep 2022 | Oct 2022 | Nov 2022 | Dec 2022 | Jan 2023 | Feb 2023 | Mar 2023 | Apr 2023 | May 2023 | Jun 2023 | |
| Switzerland | 26,418 | 34,111 | 41,598 | 28,785 | 42,500 | 37,704 | 50,147 | 41,480 | 119,880 | 41,967 | 70,302 | 110,608 | 95,663 |
| India | 52,904 | 39,974 | 59,842 | 70,393 | 56,716 | 58,369 | 52,823 | 46,467 | 67,958 | 54,277 | 46,537 | 57,139 | 52,500 |
| China | 21,477 | 24,800 | 20,212 | 29,233 | 24,472 | 27,028 | 35,931 | 29,233 | 22,258 | 23,443 | 27,338 | 27,458 | 26,483 |
| Germany | 11,460 | 16,690 | 18,747 | 15,473 | 22,292 | 29,402 | 23,324 | 19,886 | 23,958 | 8,300 | 7,256 | 11,279 | 10,263 |
| Average | 30,082 | 32,004 | 31,904 | 33,426 | 30,938 | 36,526 | 39,978 | 32,970 | 38,082 | 29,288 | 35,604 | 39,453 | 37,619 |
Brazil Nucleic Acids Import Prices by Type
There were significant differences in the average prices amongst the major supplied products. In June 2023, the product with the highest price was heterocyclic compounds; containing an unfused thiazole ring (whether or not hydrogenated) in the structure ($62,696 per ton), while the price for heterocyclic compounds; containing a benzothiazole ring-system (whether or not hydrogenated), not further fused ($3,896 per ton) was amongst the lowest.
From June 2022 to June 2023, the most notable rate of growth in terms of prices was attained by other heterocyclic compounds, n.e.s. in October 2934, 2934.2 and 2934.3 (+6.9%), while the prices for the other products experienced more modest paces of growth.
Brazil Nucleic Acids Imports
In June 2023, overseas purchases of nucleic acids and their salts decreased by -13.6% to 2.8K tons, falling for the second consecutive month after two months of growth. In general, imports saw a relatively flat trend pattern. The pace of growth appeared the most rapid in March 2023 when imports increased by 65% m-o-m.
In value terms, nucleic acids imports declined significantly to $107M (IndexBox estimates) in June 2023. Overall, total imports indicated a slight expansion from June 2022 to June 2023: its value increased at an average monthly rate of +1.6% over the last twelve months. The trend pattern, however, indicated some noticeable fluctuations being recorded throughout the analyzed period. Based on June 2023 figures, imports decreased by -18.5% against April 2023 indices. The most prominent rate of growth was recorded in April 2023 with an increase of 62% against the previous month.
Brazil Nucleic Acids Imports by Type
In June 2023, nucleic acids and their salts, other heterocyclic compounds, n.e.c. in heading number 2934 (1.8K tons) constituted the largest type of nucleic acids supplied to Brazil, accounting for a 65% share of total imports. Moreover, nucleic acids and their salts, other heterocyclic compounds, n.e.c. in heading number 2934 exceeded the figures recorded for the second-largest type, heterocyclic compounds; containing a benzothiazole ring-system (whether or not hydrogenated), not further fused (703 tons), threefold.
From June 2022 to June 2023, the average monthly growth rate of the volume of import of nucleic acids and their salts, other heterocyclic compounds, n.e.c. in heading number 2934 totaled +1.4%. With regard to the other supplied products, the following average monthly rates of growth were recorded: heterocyclic compounds; containing a benzothiazole ring-system (whether or not hydrogenated), not further fused (-3.5% per month) and heterocyclic compounds; containing an unfused thiazole ring (whether or not hydrogenated) in the structure (-0.2% per month).
In value terms, nucleic acids and their salts, other heterocyclic compounds, n.e.c. in heading number 2934 ($85M) constituted the largest type of nucleic acids supplied to Brazil, comprising 80% of total imports. The second position in the ranking was held by heterocyclic compounds; containing an unfused thiazole ring (whether or not hydrogenated) in the structure ($19M), with an 18% share of total imports.
Brazil Nucleic Acids Imports by Country
In June 2023, China (1.5K tons) constituted the largest supplier of nucleic acids to Brazil, with a 52% share of total imports. Moreover, nucleic acids imports from China exceeded the figures recorded by the second-largest supplier, Germany (530 tons), threefold. The third position in this ranking was held by India (386 tons), with a 14% share.
From June 2022 to June 2023, the average monthly rate of growth in terms of volume from China was relatively modest. The remaining supplying countries recorded the following average monthly rates of imports growth: Germany (+11.1% per month) and India (+0.3% per month).
In value terms, China ($39M), Switzerland ($24M) and India ($20M) were the largest nucleic acids suppliers to Brazil, with a combined 78% share of total imports.
Among the main suppliers, Switzerland, with a CAGR of +14.6%, saw the highest growth rate of the value of imports, over the period under review, while purchases for the other leaders experienced more modest paces of growth.
1. INTRODUCTION
Making Data-Driven Decisions to Grow Your Business
- REPORT DESCRIPTION
- RESEARCH METHODOLOGY AND THE AI PLATFORM
- DATA-DRIVEN DECISIONS FOR YOUR BUSINESS
- GLOSSARY AND SPECIFIC TERMS
2. EXECUTIVE SUMMARY
A Quick Overview of Market Performance
- KEY FINDINGS
- MARKET TRENDSThis Chapter is Available Only for the Professional EditionPRO
3. MARKET OVERVIEW
Understanding the Current State of The Market and its Prospects
- MARKET SIZE: HISTORICAL DATA (2012–2024) AND FORECAST (2025–2035)
- MARKET STRUCTURE: HISTORICAL DATA (2012–2024) AND FORECAST (2025–2035)
- TRADE BALANCE: HISTORICAL DATA (2012–2024) AND FORECAST (2025–2035)
- PER CAPITA CONSUMPTION: HISTORICAL DATA (2012–2024) AND FORECAST (2025–2035)
- MARKET FORECAST TO 2035
4. MOST PROMISING PRODUCTS FOR DIVERSIFICATION
Finding New Products to Diversify Your Business
- TOP PRODUCTS TO DIVERSIFY YOUR BUSINESS
- BEST-SELLING PRODUCTS
- MOST CONSUMED PRODUCTS
- MOST TRADED PRODUCTS
- MOST PROFITABLE PRODUCTS FOR EXPORTS
5. MOST PROMISING SUPPLYING COUNTRIES
Choosing the Best Countries to Establish Your Sustainable Supply Chain
- TOP COUNTRIES TO SOURCE YOUR PRODUCT
- TOP PRODUCING COUNTRIES
- TOP EXPORTING COUNTRIES
- LOW-COST EXPORTING COUNTRIES
6. MOST PROMISING OVERSEAS MARKETS
Choosing the Best Countries to Boost Your Export
- TOP OVERSEAS MARKETS FOR EXPORTING YOUR PRODUCT
- TOP CONSUMING MARKETS
- UNSATURATED MARKETS
- TOP IMPORTING MARKETS
- MOST PROFITABLE MARKETS
7. PRODUCTION
The Latest Trends and Insights into The Industry
- PRODUCTION VOLUME AND VALUE: HISTORICAL DATA (2012–2024) AND FORECAST (2025–2035)
8. IMPORTS
The Largest Import Supplying Countries
- IMPORTS: HISTORICAL DATA (2012–2024) AND FORECAST (2025–2035)
- IMPORTS BY COUNTRY: HISTORICAL DATA (2012–2024)
- IMPORT PRICES BY COUNTRY: HISTORICAL DATA (2012–2024)
9. EXPORTS
The Largest Destinations for Exports
- EXPORTS: HISTORICAL DATA (2012–2024) AND FORECAST (2025–2035)
- EXPORTS BY COUNTRY: HISTORICAL DATA (2012–2024)
- EXPORT PRICES BY COUNTRY: HISTORICAL DATA (2012–2024)
10. PROFILES OF MAJOR PRODUCERS
The Largest Producers on The Market and Their Profiles
LIST OF TABLES
- Key Findings In 2024
- Market Volume, In Physical Terms: Historical Data (2012–2024) and Forecast (2025–2035)
- Market Value: Historical Data (2012–2024) and Forecast (2025–2035)
- Per Capita Consumption: Historical Data (2012–2024) and Forecast (2025–2035)
- Imports, In Physical Terms, By Country, 2012–2024
- Imports, In Value Terms, By Country, 2012–2024
- Import Prices, By Country, 2012–2024
- Exports, In Physical Terms, By Country, 2012–2024
- Exports, In Value Terms, By Country, 2012–2024
- Export Prices, By Country, 2012–2024
LIST OF FIGURES
- Market Volume, In Physical Terms: Historical Data (2012–2024) and Forecast (2025–2035)
- Market Value: Historical Data (2012–2024) and Forecast (2025–2035)
- Market Structure – Domestic Supply vs. Imports, in Physical Terms: Historical Data (2012–2024) and Forecast (2025–2035)
- Market Structure – Domestic Supply vs. Imports, in Value Terms: Historical Data (2012–2024) and Forecast (2025–2035)
- Trade Balance, In Physical Terms: Historical Data (2012–2024) and Forecast (2025–2035)
- Trade Balance, In Value Terms: Historical Data (2012–2024) and Forecast (2025–2035)
- Per Capita Consumption: Historical Data (2012–2024) and Forecast (2025–2035)
- Market Volume Forecast to 2035
- Market Value Forecast to 2035
- Market Size and Growth, By Product
- Average Per Capita Consumption, By Product
- Exports and Growth, By Product
- Export Prices and Growth, By Product
- Production Volume and Growth
- Exports and Growth
- Export Prices and Growth
- Market Size and Growth
- Per Capita Consumption
- Imports and Growth
- Import Prices
- Production, In Physical Terms: Historical Data (2012–2024) and Forecast (2025–2035)
- Production, In Value Terms: Historical Data (2012–2024) and Forecast (2025–2035)
- Imports, In Physical Terms: Historical Data (2012–2024) and Forecast (2025–2035)
- Imports, In Value Terms: Historical Data (2012–2024) and Forecast (2025–2035)
- Imports, In Physical Terms, By Country, 2024
- Imports, In Physical Terms, By Country, 2012–2024
- Imports, In Value Terms, By Country, 2012–2024
- Import Prices, By Country, 2012–2024
- Exports, In Physical Terms: Historical Data (2012–2024) and Forecast (2025–2035)
- Exports, In Value Terms: Historical Data (2012–2024) and Forecast (2025–2035)
- Exports, In Physical Terms, By Country, 2024
- Exports, In Physical Terms, By Country, 2012–2024
- Exports, In Value Terms, By Country, 2012–2024
- Export Prices, By Country, 2012–2024


