
China - Ceramic Tile - Market Analysis, Forecast, Size, Trends and Insights
Get instant access to more than 2 million reports, dashboards, and datasets on the IndexBox Platform.
View PricingChina's June 2023 Export of Ceramic Tiles Drops to $392M
China Ceramic Tile Exports
In June 2023, shipments abroad of ceramic tiles increased by 3.7% to 56M square meters, rising for the fourth consecutive month after two months of decline. In general, exports, however, saw a relatively flat trend pattern. The growth pace was the most rapid in March 2023 when exports increased by 92% month-to-month. The exports peaked at 63M square meters in December 2022; however, from January 2023 to June 2023, the exports stood at a somewhat lower figure.
In value terms, ceramic tile exports reduced to $392M (IndexBox estimates) in June 2023. Overall, exports, however, continue to indicate a mild downturn. The pace of growth was the most pronounced in March 2023 with an increase of 102% month-to-month. Over the period under review, the exports reached the maximum at 616M square meters in December 2022; however, from January 2023 to June 2023, the exports stood at a somewhat lower figure. 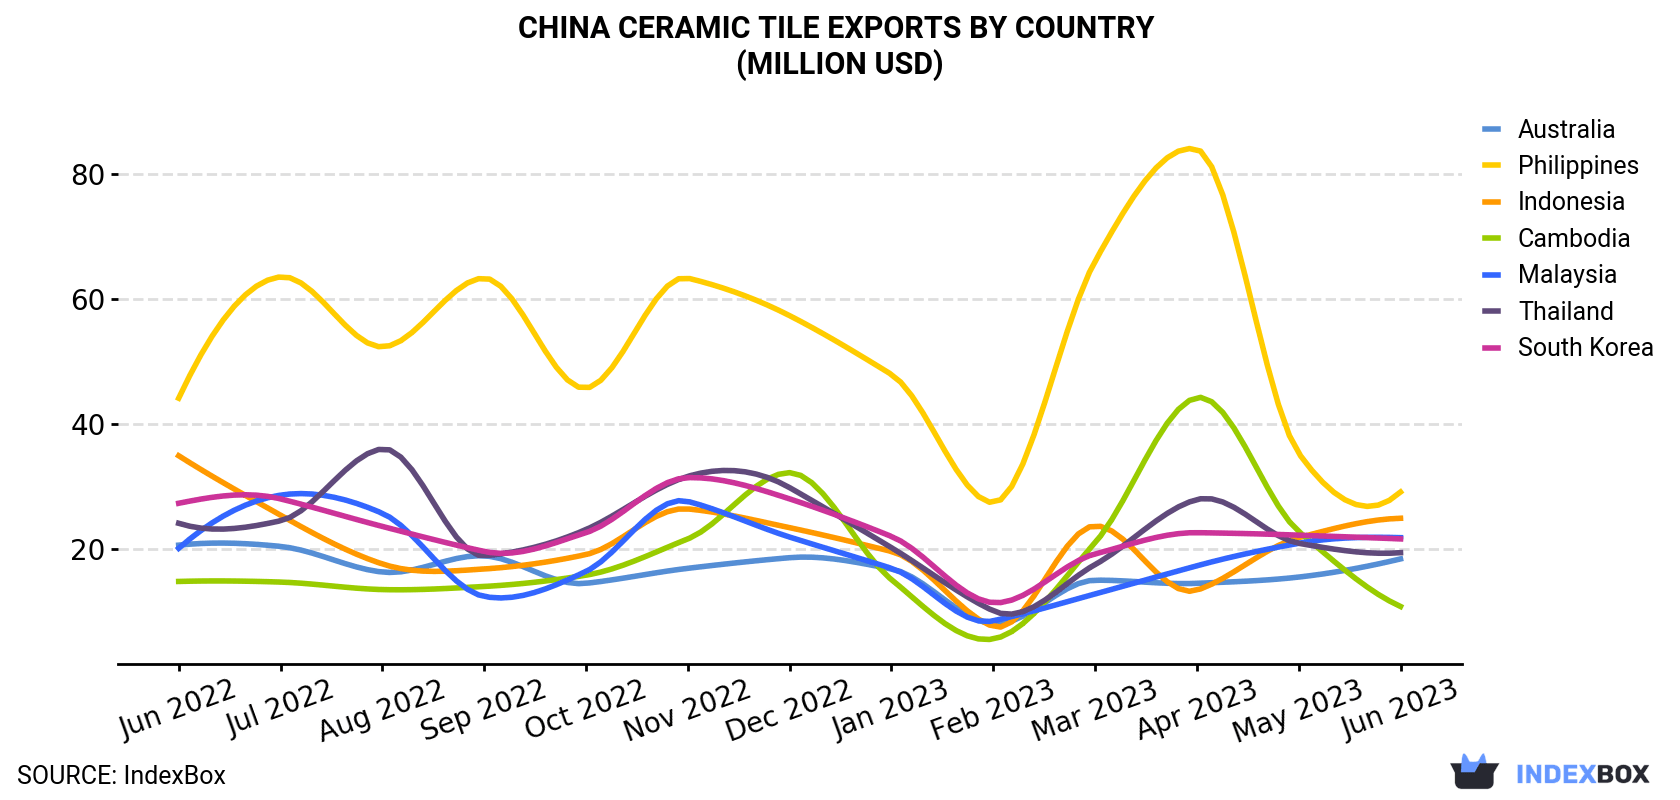
| COUNTRY | Export Value of Ceramic Tile in China (million USD) | ||||||||||||
|---|---|---|---|---|---|---|---|---|---|---|---|---|---|
| Jun 2022 | Jul 2022 | Aug 2022 | Sep 2022 | Oct 2022 | Nov 2022 | Dec 2022 | Jan 2023 | Feb 2023 | Mar 2023 | Apr 2023 | May 2023 | Jun 2023 | |
| Philippines | 44.1 | 63.5 | 52.3 | 63.3 | 45.7 | 63.3 | 57.3 | 47.9 | 27.4 | 66.0 | 83.9 | 35.3 | 29.1 |
| Indonesia | 34.9 | 25.4 | 17.6 | 16.8 | 19.1 | 26.4 | 23.4 | 19.6 | 7.6 | 23.7 | 13.4 | 21.8 | 24.9 |
| Malaysia | 20.1 | 28.6 | 25.7 | 12.4 | 16.4 | 27.6 | 21.9 | 16.9 | 8.5 | 12.8 | 17.3 | 20.9 | 21.8 |
| South Korea | 27.3 | 28.0 | 23.6 | 19.6 | 22.6 | 31.4 | 28.0 | 22.0 | 11.4 | 19.2 | 22.6 | 22.2 | 21.6 |
| Thailand | 24.1 | 24.5 | 36.0 | 18.9 | 23.1 | 31.6 | 29.8 | 20.2 | 10.1 | 17.5 | 27.9 | 20.9 | 19.4 |
| Australia | 20.6 | 20.4 | 16.3 | 18.9 | 14.5 | 16.9 | 18.6 | 16.8 | 8.0 | 15.0 | 14.5 | 15.5 | 18.4 |
| Cambodia | 14.8 | 14.7 | 13.5 | 14.0 | 15.8 | 21.6 | 32.2 | 15.1 | 5.6 | 21.0 | 44.2 | 22.8 | 10.8 |
| Others | 263 | 252 | 233 | 282 | 350 | 376 | 404 | 237 | 169 | 325 | 350 | 253 | 246 |
| Total | 449 | 457 | 418 | 446 | 507 | 595 | 616 | 396 | 247 | 500 | 573 | 413 | 392 |
Exports by Country
The Philippines (7.2M square meters), Indonesia (6.8M square meters) and South Korea (5M square meters) were the main destinations of ceramic tile exports from China, together comprising 34% of total exports. These countries were followed by Malaysia, Thailand, Australia and Cambodia, which together accounted for a further 22%.
From June 2022 to June 2023, the biggest increases were in Malaysia (with a CAGR of +0.3%), while shipments for the other leaders experienced a decline.
In value terms, the Philippines ($29M), Indonesia ($25M) and Malaysia ($22M) appeared to be the largest markets for ceramic tile exported from China worldwide, together comprising 19% of total exports.
In terms of the main countries of destination, Malaysia, with a CAGR of +0.7%, recorded the highest rates of growth with regard to the value of exports, over the period under review, while shipments for the other leaders experienced a decline.
Export Prices by Country
In June 2023, the ceramic tile price amounted to $7.0 per square meter (FOB, China), declining by -8.3% against the previous month. Overall, the export price saw a mild shrinkage. The pace of growth appeared the most rapid in February 2023 an increase of 29% m-o-m. Over the period under review, the average export prices reached the peak figure at $11.5 per square meter in April 2023; however, from May 2023 to June 2023, the export prices failed to regain momentum.
Prices varied noticeably by the country of destination: the country with the highest price was Vietnam ($25.4 per square meter), while the average price for exports to the Dominican Republic ($3.2 per square meter) was amongst the lowest.
From June 2022 to June 2023, the most notable rate of growth in terms of prices was recorded for supplies to Thailand (+1.1%), while the prices for the other major destinations experienced mixed trend patterns.
This report provides an in-depth analysis of the ceramic tile market in China. Within it, you will discover the latest data on market trends and opportunities by country, consumption, production and price developments, as well as the global trade (imports and exports). The forecast exhibits the market prospects through 2030.
Product coverage:
- Prodcom 23311000 -
- Prodcom 23311010 - Unglazed ceramic mosaic tiles, cubes and similar articles, w ith a surface area < .49 cm.
- Prodcom 23311020 - Glazed ceramic mosaic tiles, cubes and similar articles, with a surface area < .49 cm.
- Prodcom 23311030 -
- Prodcom 23311050 - Unglazed ceramic and stoneware flags and paving, hearth or wall tiles, unglazed ceramic and stoneware mosaic cubes and the like, whether or not on a backing
- Prodcom 23311053 -
- Prodcom 23311057 -
- Prodcom 23311071 - Glazed ceramic double tiles of the spaltplatten type
- Prodcom 23311073 - Glazed stoneware flags and paving, hearth or wall tiles, with a face of > .90 cm.
- Prodcom 23311075 - Glazed earthenware or fine pottery ceramic flags and paving, h earth or wall tiles, with a face of > .90 cm.
- Prodcom 23311079 - Glazed ceramic flags and paving, hearth or wall tiles excluding double tiles of the spaltplatten type, stoneware, e arthenware or fine pottery flags, paving or tiles with a face of not > .90 cm.
Country coverage:
Data coverage:
- Market volume and value
- Per Capita consumption
- Forecast of the market dynamics in the medium term
- Trade (exports and imports) in China
- Export and import prices
- Market trends, drivers and restraints
- Key market players and their profiles
Reasons to buy this report:
- Take advantage of the latest data
- Find deeper insights into current market developments
- Discover vital success factors affecting the market
This report is designed for manufacturers, distributors, importers, and wholesalers, as well as for investors, consultants and advisors.
In this report, you can find information that helps you to make informed decisions on the following issues:
- How to diversify your business and benefit from new market opportunities
- How to load your idle production capacity
- How to boost your sales on overseas markets
- How to increase your profit margins
- How to make your supply chain more sustainable
- How to reduce your production and supply chain costs
- How to outsource production to other countries
- How to prepare your business for global expansion
While doing this research, we combine the accumulated expertise of our analysts and the capabilities of artificial intelligence. The AI-based platform, developed by our data scientists, constitutes the key working tool for business analysts, empowering them to discover deep insights and ideas from the marketing data.
1. INTRODUCTION
Making Data-Driven Decisions to Grow Your Business
- REPORT DESCRIPTION
- RESEARCH METHODOLOGY AND THE AI PLATFORM
- DATA-DRIVEN DECISIONS FOR YOUR BUSINESS
- GLOSSARY AND SPECIFIC TERMS
2. EXECUTIVE SUMMARY
A Quick Overview of Market Performance
- KEY FINDINGS
- MARKET TRENDSThis Chapter is Available Only for the Professional EditionPRO
3. MARKET OVERVIEW
Understanding the Current State of The Market and its Prospects
- MARKET SIZE: HISTORICAL DATA (2012–2024) AND FORECAST (2025–2035)
- MARKET STRUCTURE: HISTORICAL DATA (2012–2024) AND FORECAST (2025–2035)
- TRADE BALANCE: HISTORICAL DATA (2012–2024) AND FORECAST (2025–2035)
- PER CAPITA CONSUMPTION: HISTORICAL DATA (2012–2024) AND FORECAST (2025–2035)
- MARKET FORECAST TO 2035
4. MOST PROMISING PRODUCTS FOR DIVERSIFICATION
Finding New Products to Diversify Your Business
- TOP PRODUCTS TO DIVERSIFY YOUR BUSINESS
- BEST-SELLING PRODUCTS
- MOST CONSUMED PRODUCTS
- MOST TRADED PRODUCTS
- MOST PROFITABLE PRODUCTS FOR EXPORTS
5. MOST PROMISING SUPPLYING COUNTRIES
Choosing the Best Countries to Establish Your Sustainable Supply Chain
- TOP COUNTRIES TO SOURCE YOUR PRODUCT
- TOP PRODUCING COUNTRIES
- TOP EXPORTING COUNTRIES
- LOW-COST EXPORTING COUNTRIES
6. MOST PROMISING OVERSEAS MARKETS
Choosing the Best Countries to Boost Your Export
- TOP OVERSEAS MARKETS FOR EXPORTING YOUR PRODUCT
- TOP CONSUMING MARKETS
- UNSATURATED MARKETS
- TOP IMPORTING MARKETS
- MOST PROFITABLE MARKETS
7. PRODUCTION
The Latest Trends and Insights into The Industry
- PRODUCTION VOLUME AND VALUE: HISTORICAL DATA (2012–2024) AND FORECAST (2025–2035)
8. IMPORTS
The Largest Import Supplying Countries
- IMPORTS: HISTORICAL DATA (2012–2024) AND FORECAST (2025–2035)
- IMPORTS BY COUNTRY: HISTORICAL DATA (2012–2024)
- IMPORT PRICES BY COUNTRY: HISTORICAL DATA (2012–2024)
9. EXPORTS
The Largest Destinations for Exports
- EXPORTS: HISTORICAL DATA (2012–2024) AND FORECAST (2025–2035)
- EXPORTS BY COUNTRY: HISTORICAL DATA (2012–2024)
- EXPORT PRICES BY COUNTRY: HISTORICAL DATA (2012–2024)
10. PROFILES OF MAJOR PRODUCERS
The Largest Producers on The Market and Their Profiles
LIST OF TABLES
- Key Findings In 2024
- Market Volume, In Physical Terms: Historical Data (2012–2024) and Forecast (2025–2035)
- Market Value: Historical Data (2012–2024) and Forecast (2025–2035)
- Per Capita Consumption: Historical Data (2012–2024) and Forecast (2025–2035)
- Imports, In Physical Terms, By Country, 2012–2024
- Imports, In Value Terms, By Country, 2012–2024
- Import Prices, By Country, 2012–2024
- Exports, In Physical Terms, By Country, 2012–2024
- Exports, In Value Terms, By Country, 2012–2024
- Export Prices, By Country, 2012–2024
LIST OF FIGURES
- Market Volume, In Physical Terms: Historical Data (2012–2024) and Forecast (2025–2035)
- Market Value: Historical Data (2012–2024) and Forecast (2025–2035)
- Market Structure – Domestic Supply vs. Imports, in Physical Terms: Historical Data (2012–2024) and Forecast (2025–2035)
- Market Structure – Domestic Supply vs. Imports, in Value Terms: Historical Data (2012–2024) and Forecast (2025–2035)
- Trade Balance, In Physical Terms: Historical Data (2012–2024) and Forecast (2025–2035)
- Trade Balance, In Value Terms: Historical Data (2012–2024) and Forecast (2025–2035)
- Per Capita Consumption: Historical Data (2012–2024) and Forecast (2025–2035)
- Market Volume Forecast to 2035
- Market Value Forecast to 2035
- Market Size and Growth, By Product
- Average Per Capita Consumption, By Product
- Exports and Growth, By Product
- Export Prices and Growth, By Product
- Production Volume and Growth
- Exports and Growth
- Export Prices and Growth
- Market Size and Growth
- Per Capita Consumption
- Imports and Growth
- Import Prices
- Production, In Physical Terms: Historical Data (2012–2024) and Forecast (2025–2035)
- Production, In Value Terms: Historical Data (2012–2024) and Forecast (2025–2035)
- Imports, In Physical Terms: Historical Data (2012–2024) and Forecast (2025–2035)
- Imports, In Value Terms: Historical Data (2012–2024) and Forecast (2025–2035)
- Imports, In Physical Terms, By Country, 2024
- Imports, In Physical Terms, By Country, 2012–2024
- Imports, In Value Terms, By Country, 2012–2024
- Import Prices, By Country, 2012–2024
- Exports, In Physical Terms: Historical Data (2012–2024) and Forecast (2025–2035)
- Exports, In Value Terms: Historical Data (2012–2024) and Forecast (2025–2035)
- Exports, In Physical Terms, By Country, 2024
- Exports, In Physical Terms, By Country, 2012–2024
- Exports, In Value Terms, By Country, 2012–2024
- Export Prices, By Country, 2012–2024


