
Hong Kong SAR, China - Mushrooms (Dried) - Market Analysis, Forecast, Size, Trends and Insights
Get instant access to more than 2 million reports, dashboards, and datasets on the IndexBox Platform.
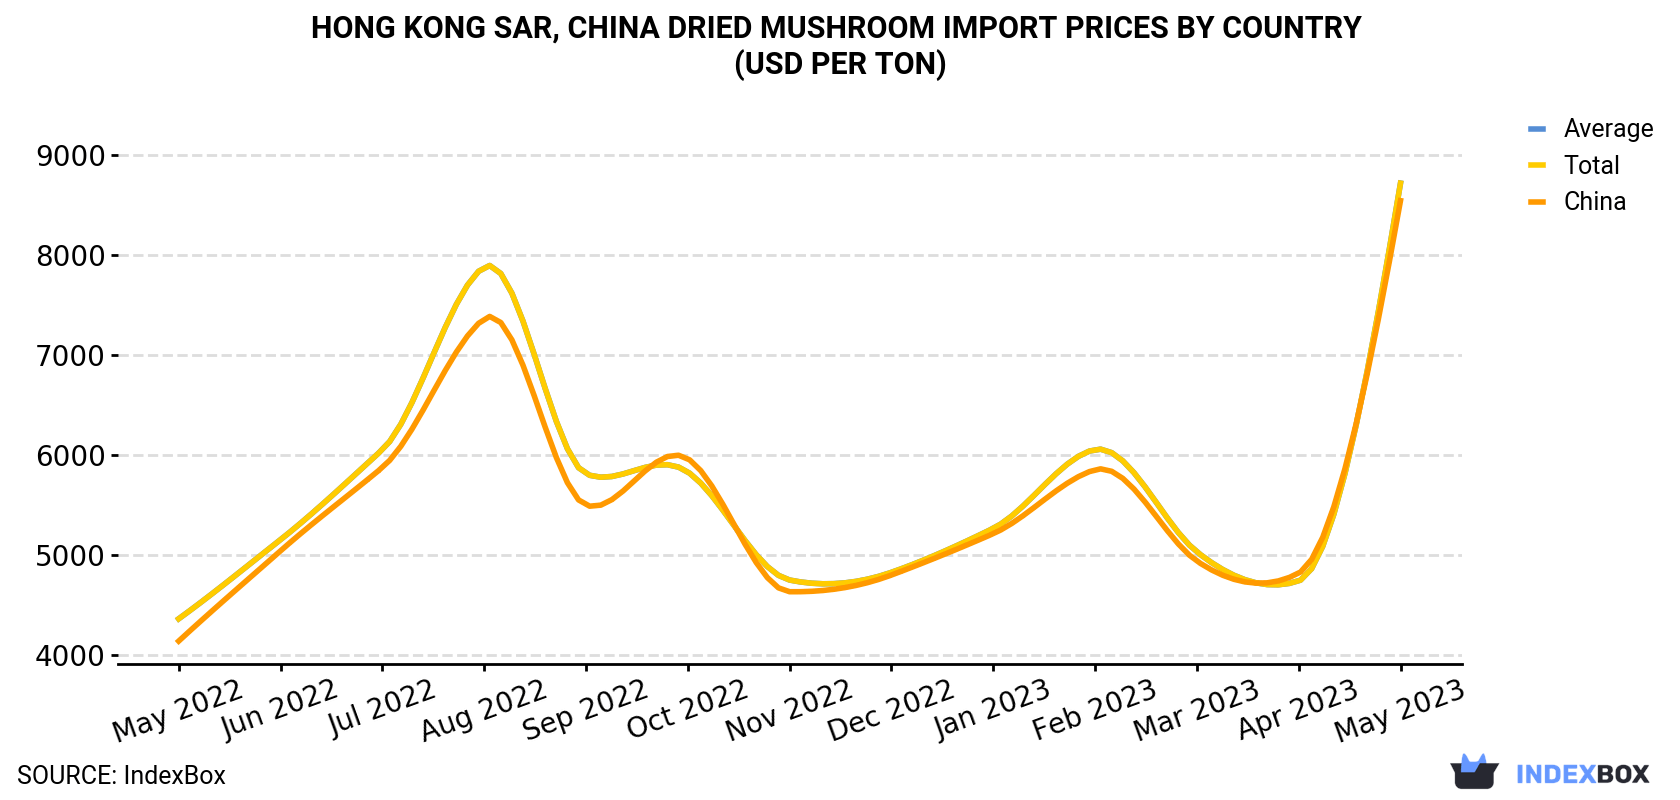
View PricingSignificant Surge in Dried Mushroom Price in Hong Kong Reaches $8,720 per Ton
Hong Kong Dried Mushroom Import Price in May 2023
In May 2023, the dried mushroom price stood at $8,720 per ton (CIF, Hong Kong), increasing by 84% against the previous month. Overall, import price indicated a buoyant expansion from May 2022 to May 2023: its price increased at an average monthly rate of +5.9% over the last twelve months. The trend pattern, however, indicated some noticeable fluctuations being recorded throughout the analyzed period. Based on May 2023 figures, dried mushroom import price increased by +84.0% against April 2023 indices. As a result, import price attained the peak level and is likely to continue growth in the immediate term.
As there is only one major supplying country, the average price level is determined by prices for China.
From May 2022 to May 2023, the rate of growth in terms of prices for China amounted to +6.2% per month.
Hong Kong Dried Mushroom Import Prices by Type
There were significant differences in the average prices amongst the major supplied products. In May 2023, the product with the highest price was vegetables; jelly fungi (tremella spp)), whole, cut, sliced, broken or in powder but not further prepared, dried ($15,045 per ton), while the price for vegetables; mushrooms, other than the genus agaricus and truffles, whole, cut, sliced, broken or in powder but not further prepared, dried ($8,524 per ton) was amongst the lowest.
From May 2022 to May 2023, the most notable rate of growth in terms of prices was attained by vegetables; mushrooms, other than the genus agaricus and truffles, whole, cut, sliced, broken or in powder but not further prepared, dried (+7.7%), while the prices for the other products experienced more modest paces of growth.
Hong Kong Dried Mushroom Imports
In May 2023, approximately 1.1K tons of dried mushrooms and truffles were imported into Hong Kong; increasing by 18% on April 2023. Overall, imports, however, showed a relatively flat trend pattern. The most prominent rate of growth was recorded in September 2022 when imports increased by 47% against the previous month.
In value terms, dried mushroom imports skyrocketed to $9.4M (IndexBox estimates) in May 2023. In general, total imports indicated a buoyant expansion from May 2022 to May 2023: its value increased at an average monthly rate of +5.6% over the last twelve months. The trend pattern, however, indicated some noticeable fluctuations being recorded throughout the analyzed period. Based on May 2023 figures, imports increased by +118.1% against February 2023 indices. As a result, imports reached the peak and are likely to continue growth in the immediate term.
Hong Kong Dried Mushroom Imports by Type
In May 2023, vegetables; mushrooms, other than the genus agaricus and truffles, whole, cut, sliced, broken or in powder but not further prepared, dried (1K tons) was the main type of dried mushroom supplied to Hong Kong, with a 94% share of total imports. It was followed by vegetables; wood ears (auricularia spp), whole, cut, sliced, broken or in powder but not further prepared, dried (32 tons), with a 3% share of total imports. The third position in this ranking was taken by vegetables; mushrooms of the genus agaricus, whole, cut, sliced, broken or in powder but not further prepared, dried (25 tons), with a 2.3% share.
From May 2022 to May 2023, the average monthly growth rate of the volume of import of vegetables; mushrooms, other than the genus agaricus and truffles, whole, cut, sliced, broken or in powder but not further prepared, dried was relatively modest. With regard to the other supplied products, the following average monthly rates of growth were recorded: vegetables; wood ears (auricularia spp), whole, cut, sliced, broken or in powder but not further prepared, dried (+4.1% per month) and vegetables; mushrooms of the genus agaricus, whole, cut, sliced, broken or in powder but not further prepared, dried (-4.7% per month).
In value terms, vegetables; mushrooms, other than the genus agaricus and truffles, whole, cut, sliced, broken or in powder but not further prepared, dried ($8.6M) constituted the largest type of dried mushroom supplied to Hong Kong, comprising 91% of total imports. The second position in the ranking was held by vegetables; wood ears (auricularia spp), whole, cut, sliced, broken or in powder but not further prepared, dried ($378K), with a 4% share of total imports. It was followed by vegetables; mushrooms of the genus agaricus, whole, cut, sliced, broken or in powder but not further prepared, dried, with a 2.5% share.
Hong Kong Dried Mushroom Imports by Country
In May 2023, China (1.1K tons) was the main supplier of dried mushroom to Hong Kong, accounting for a approximately 98% share of total imports.
From May 2022 to May 2023, the average monthly growth rate of volume from China was relatively modest.
In value terms, China ($9M) constituted the largest supplier of dried mushroom to Hong Kong.
From May 2022 to May 2023, the average monthly growth rate of value from China amounted to +6.3%.
This report provides an in-depth analysis of the dried mushroom market in Hong Kong SAR, China. Within it, you will discover the latest data on market trends and opportunities by country, consumption, production and price developments, as well as the global trade (imports and exports). The forecast exhibits the market prospects through 2030.
Product coverage:
- FCL 450 - Dried Mushrooms
Country coverage:
- Hong Kong SAR
Data coverage:
- Market volume and value
- Per Capita consumption
- Forecast of the market dynamics in the medium term
- Trade (exports and imports) in Hong Kong SAR, China
- Export and import prices
- Market trends, drivers and restraints
- Key market players and their profiles
Reasons to buy this report:
- Take advantage of the latest data
- Find deeper insights into current market developments
- Discover vital success factors affecting the market
This report is designed for manufacturers, distributors, importers, and wholesalers, as well as for investors, consultants and advisors.
In this report, you can find information that helps you to make informed decisions on the following issues:
- How to diversify your business and benefit from new market opportunities
- How to load your idle production capacity
- How to boost your sales on overseas markets
- How to increase your profit margins
- How to make your supply chain more sustainable
- How to reduce your production and supply chain costs
- How to outsource production to other countries
- How to prepare your business for global expansion
While doing this research, we combine the accumulated expertise of our analysts and the capabilities of artificial intelligence. The AI-based platform, developed by our data scientists, constitutes the key working tool for business analysts, empowering them to discover deep insights and ideas from the marketing data.
1. INTRODUCTION
Making Data-Driven Decisions to Grow Your Business
- REPORT DESCRIPTION
- RESEARCH METHODOLOGY AND THE AI PLATFORM
- DATA-DRIVEN DECISIONS FOR YOUR BUSINESS
- GLOSSARY AND SPECIFIC TERMS
2. EXECUTIVE SUMMARY
A Quick Overview of Market Performance
- KEY FINDINGS
- MARKET TRENDSThis Chapter is Available Only for the Professional EditionPRO
3. MARKET OVERVIEW
Understanding the Current State of The Market and its Prospects
- MARKET SIZE: HISTORICAL DATA (2012–2024) AND FORECAST (2025–2035)
- MARKET STRUCTURE: HISTORICAL DATA (2012–2024) AND FORECAST (2025–2035)
- TRADE BALANCE: HISTORICAL DATA (2012–2024) AND FORECAST (2025–2035)
- PER CAPITA CONSUMPTION: HISTORICAL DATA (2012–2024) AND FORECAST (2025–2035)
- MARKET FORECAST TO 2035
4. MOST PROMISING PRODUCTS FOR DIVERSIFICATION
Finding New Products to Diversify Your Business
- TOP PRODUCTS TO DIVERSIFY YOUR BUSINESS
- BEST-SELLING PRODUCTS
- MOST CONSUMED PRODUCTS
- MOST TRADED PRODUCTS
- MOST PROFITABLE PRODUCTS FOR EXPORTS
5. MOST PROMISING SUPPLYING COUNTRIES
Choosing the Best Countries to Establish Your Sustainable Supply Chain
- TOP COUNTRIES TO SOURCE YOUR PRODUCT
- TOP PRODUCING COUNTRIES
- TOP EXPORTING COUNTRIES
- LOW-COST EXPORTING COUNTRIES
6. MOST PROMISING OVERSEAS MARKETS
Choosing the Best Countries to Boost Your Export
- TOP OVERSEAS MARKETS FOR EXPORTING YOUR PRODUCT
- TOP CONSUMING MARKETS
- UNSATURATED MARKETS
- TOP IMPORTING MARKETS
- MOST PROFITABLE MARKETS
7. PRODUCTION
The Latest Trends and Insights into The Industry
- PRODUCTION VOLUME AND VALUE: HISTORICAL DATA (2012–2024) AND FORECAST (2025–2035)
8. IMPORTS
The Largest Import Supplying Countries
- IMPORTS: HISTORICAL DATA (2012–2024) AND FORECAST (2025–2035)
- IMPORTS BY COUNTRY: HISTORICAL DATA (2012–2024)
- IMPORT PRICES BY COUNTRY: HISTORICAL DATA (2012–2024)
9. EXPORTS
The Largest Destinations for Exports
- EXPORTS: HISTORICAL DATA (2012–2024) AND FORECAST (2025–2035)
- EXPORTS BY COUNTRY: HISTORICAL DATA (2012–2024)
- EXPORT PRICES BY COUNTRY: HISTORICAL DATA (2012–2024)
10. PROFILES OF MAJOR PRODUCERS
The Largest Producers on The Market and Their Profiles
LIST OF TABLES
- Key Findings In 2024
- Market Volume, In Physical Terms: Historical Data (2012–2024) and Forecast (2025–2035)
- Market Value: Historical Data (2012–2024) and Forecast (2025–2035)
- Per Capita Consumption: Historical Data (2012–2024) and Forecast (2025–2035)
- Imports, In Physical Terms, By Country, 2012–2024
- Imports, In Value Terms, By Country, 2012–2024
- Import Prices, By Country, 2012–2024
- Exports, In Physical Terms, By Country, 2012–2024
- Exports, In Value Terms, By Country, 2012–2024
- Export Prices, By Country, 2012–2024
LIST OF FIGURES
- Market Volume, In Physical Terms: Historical Data (2012–2024) and Forecast (2025–2035)
- Market Value: Historical Data (2012–2024) and Forecast (2025–2035)
- Market Structure – Domestic Supply vs. Imports, in Physical Terms: Historical Data (2012–2024) and Forecast (2025–2035)
- Market Structure – Domestic Supply vs. Imports, in Value Terms: Historical Data (2012–2024) and Forecast (2025–2035)
- Trade Balance, In Physical Terms: Historical Data (2012–2024) and Forecast (2025–2035)
- Trade Balance, In Value Terms: Historical Data (2012–2024) and Forecast (2025–2035)
- Per Capita Consumption: Historical Data (2012–2024) and Forecast (2025–2035)
- Market Volume Forecast to 2035
- Market Value Forecast to 2035
- Market Size and Growth, By Product
- Average Per Capita Consumption, By Product
- Exports and Growth, By Product
- Export Prices and Growth, By Product
- Production Volume and Growth
- Exports and Growth
- Export Prices and Growth
- Market Size and Growth
- Per Capita Consumption
- Imports and Growth
- Import Prices
- Production, In Physical Terms: Historical Data (2012–2024) and Forecast (2025–2035)
- Production, In Value Terms: Historical Data (2012–2024) and Forecast (2025–2035)
- Imports, In Physical Terms: Historical Data (2012–2024) and Forecast (2025–2035)
- Imports, In Value Terms: Historical Data (2012–2024) and Forecast (2025–2035)
- Imports, In Physical Terms, By Country, 2024
- Imports, In Physical Terms, By Country, 2012–2024
- Imports, In Value Terms, By Country, 2012–2024
- Import Prices, By Country, 2012–2024
- Exports, In Physical Terms: Historical Data (2012–2024) and Forecast (2025–2035)
- Exports, In Value Terms: Historical Data (2012–2024) and Forecast (2025–2035)
- Exports, In Physical Terms, By Country, 2024
- Exports, In Physical Terms, By Country, 2012–2024
- Exports, In Value Terms, By Country, 2012–2024
- Export Prices, By Country, 2012–2024


