
Japan - Prepared Mustard - Market Analysis, Forecast, Size, Trends And Insights
Get instant access to more than 2 million reports, dashboards, and datasets on the IndexBox Platform.
View PricingJapan's Price for Mustard Slides to $2,821 per Ton
Japan Prepared Mustard Import Price in April 2023
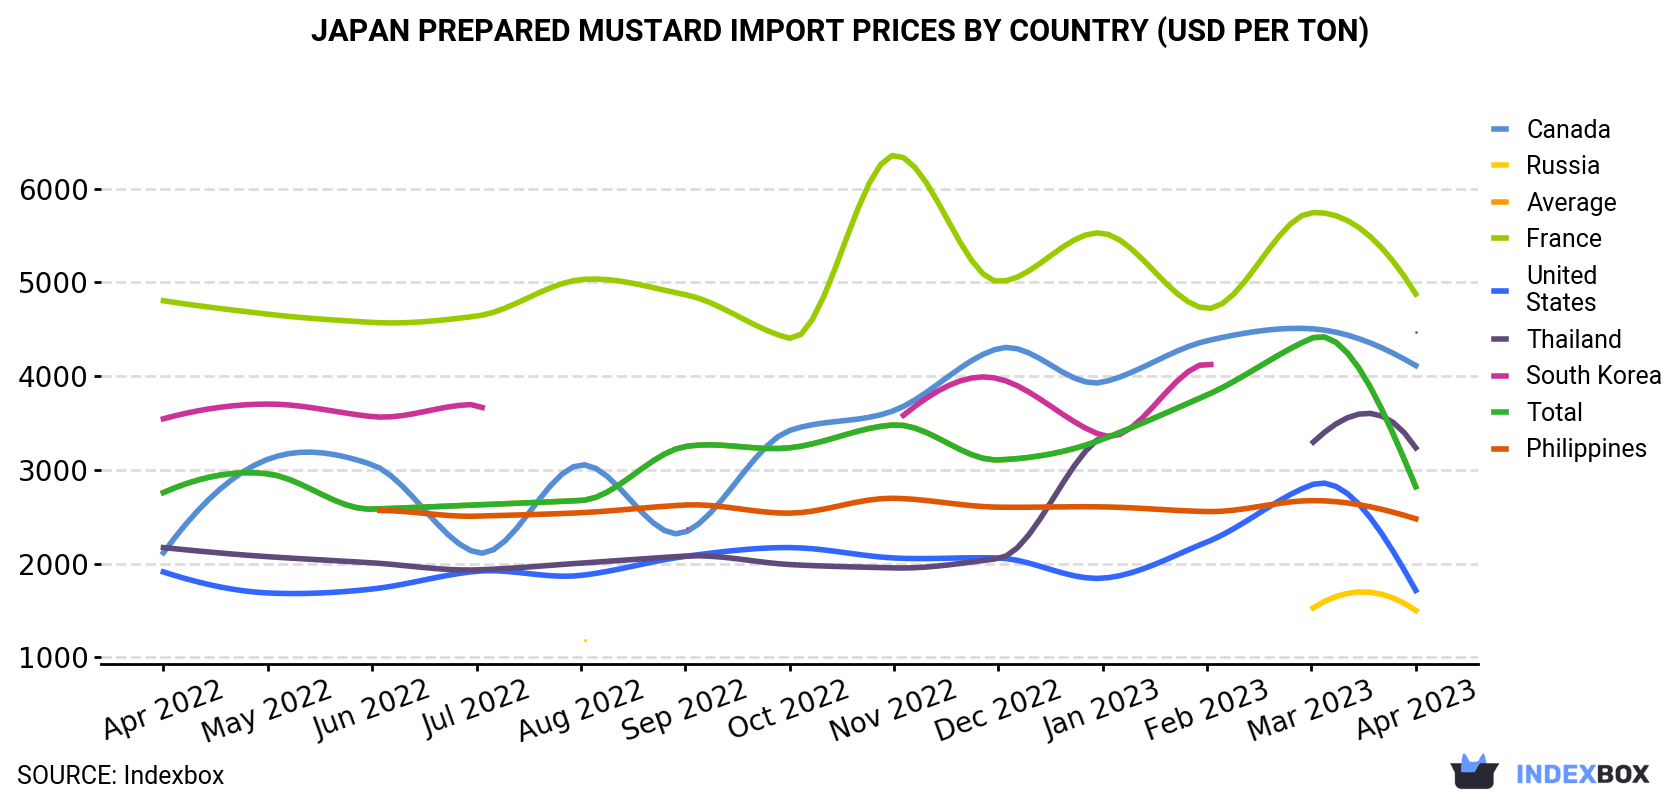
In April 2023, the prepared mustard price stood at $2,821 per ton (CIF, Japan), falling by -35.9% against the previous month. Overall, the import price, however, saw a relatively flat trend pattern. The most prominent rate of growth was recorded in September 2022 an increase of 22% month-to-month. The import price peaked at $4,404 per ton in March 2023, and then shrank rapidly in the following month.
There were significant differences in the average prices amongst the major supplying countries. In April 2023, the country with the highest price was France ($4,876 per ton), while the price for Russia ($1,501 per ton) was amongst the lowest.
From April 2022 to April 2023, the most notable rate of growth in terms of prices was attained by Canada (+5.7%), while the prices for the other major suppliers experienced more modest paces of growth.
Japan Prepared Mustard Imports
After four months of decline, supplies from abroad of prepared mustard increased by 29% to 513 tons in April 2023. Overall, imports, however, continue to indicate a relatively flat trend pattern. The pace of growth appeared the most rapid in November 2022 when imports increased by 34% month-to-month.
In value terms, prepared mustard imports fell dramatically to $1.4M (IndexBox estimates) in April 2023. In general, imports saw a relatively flat trend pattern. The pace of growth appeared the most rapid in November 2022 with an increase of 45% against the previous month.
Japan Prepared Mustard Imports by Country
In April 2023, the United States (274 tons) constituted the largest supplier of prepared mustard to Japan, accounting for a 54% share of total imports. Moreover, prepared mustard imports from the United States exceeded the figures recorded by the second-largest supplier, France (103 tons), threefold. The third position in this ranking was held by Canada (50 tons), with a 9.7% share.
From April 2022 to April 2023, the average monthly growth rate of volume from the United States was relatively modest. The remaining supplying countries recorded the following average monthly rates of imports growth: France (+0.0% per month) and Canada (-4.7% per month).
In value terms, France ($503K), the United States ($471K) and Canada ($205K) appeared to be the largest prepared mustard suppliers to Japan, together accounting for 81% of total imports. Thailand, South Korea, the Philippines and Russia lagged somewhat behind, together comprising a further 14%.
Thailand, with a CAGR of +11.6%, saw the highest rates of growth with regard to the value of imports, among the main suppliers over the period under review, while purchases for the other leaders experienced more modest paces of growth.
This report provides an in-depth analysis of the prepared mustard market in Japan. Within it, you will discover the latest data on market trends and opportunities by country, consumption, production and price developments, as well as the global trade (imports and exports). The forecast exhibits the market prospects through 2030.
Product coverage:
- Prodcom 10841253 - Mustard flour and meal
- Prodcom 10841255 - Prepared mustard
Country coverage:
- Japan
Data coverage:
- Market volume and value
- Per Capita consumption
- Forecast of the market dynamics in the medium term
- Trade (exports and imports) in Japan
- Export and import prices
- Market trends, drivers and restraints
- Key market players and their profiles
Reasons to buy this report:
- Take advantage of the latest data
- Find deeper insights into current market developments
- Discover vital success factors affecting the market
This report is designed for manufacturers, distributors, importers, and wholesalers, as well as for investors, consultants and advisors.
In this report, you can find information that helps you to make informed decisions on the following issues:
- How to diversify your business and benefit from new market opportunities
- How to load your idle production capacity
- How to boost your sales on overseas markets
- How to increase your profit margins
- How to make your supply chain more sustainable
- How to reduce your production and supply chain costs
- How to outsource production to other countries
- How to prepare your business for global expansion
While doing this research, we combine the accumulated expertise of our analysts and the capabilities of artificial intelligence. The AI-based platform, developed by our data scientists, constitutes the key working tool for business analysts, empowering them to discover deep insights and ideas from the marketing data.
1. INTRODUCTION
Making Data-Driven Decisions to Grow Your Business
- REPORT DESCRIPTION
- RESEARCH METHODOLOGY AND THE AI PLATFORM
- DATA-DRIVEN DECISIONS FOR YOUR BUSINESS
- GLOSSARY AND SPECIFIC TERMS
2. EXECUTIVE SUMMARY
A Quick Overview of Market Performance
- KEY FINDINGS
- MARKET TRENDSThis Chapter is Available Only for the Professional EditionPRO
3. MARKET OVERVIEW
Understanding the Current State of The Market and its Prospects
- MARKET SIZE: HISTORICAL DATA (2012–2024) AND FORECAST (2025–2035)
- MARKET STRUCTURE: HISTORICAL DATA (2012–2024) AND FORECAST (2025–2035)
- TRADE BALANCE: HISTORICAL DATA (2012–2024) AND FORECAST (2025–2035)
- PER CAPITA CONSUMPTION: HISTORICAL DATA (2012–2024) AND FORECAST (2025–2035)
- MARKET FORECAST TO 2035
4. MOST PROMISING PRODUCTS FOR DIVERSIFICATION
Finding New Products to Diversify Your Business
- TOP PRODUCTS TO DIVERSIFY YOUR BUSINESS
- BEST-SELLING PRODUCTS
- MOST CONSUMED PRODUCTS
- MOST TRADED PRODUCTS
- MOST PROFITABLE PRODUCTS FOR EXPORTS
5. MOST PROMISING SUPPLYING COUNTRIES
Choosing the Best Countries to Establish Your Sustainable Supply Chain
- TOP COUNTRIES TO SOURCE YOUR PRODUCT
- TOP PRODUCING COUNTRIES
- TOP EXPORTING COUNTRIES
- LOW-COST EXPORTING COUNTRIES
6. MOST PROMISING OVERSEAS MARKETS
Choosing the Best Countries to Boost Your Export
- TOP OVERSEAS MARKETS FOR EXPORTING YOUR PRODUCT
- TOP CONSUMING MARKETS
- UNSATURATED MARKETS
- TOP IMPORTING MARKETS
- MOST PROFITABLE MARKETS
7. PRODUCTION
The Latest Trends and Insights into The Industry
- PRODUCTION VOLUME AND VALUE: HISTORICAL DATA (2012–2024) AND FORECAST (2025–2035)
8. IMPORTS
The Largest Import Supplying Countries
- IMPORTS: HISTORICAL DATA (2012–2024) AND FORECAST (2025–2035)
- IMPORTS BY COUNTRY: HISTORICAL DATA (2012–2024)
- IMPORT PRICES BY COUNTRY: HISTORICAL DATA (2012–2024)
9. EXPORTS
The Largest Destinations for Exports
- EXPORTS: HISTORICAL DATA (2012–2024) AND FORECAST (2025–2035)
- EXPORTS BY COUNTRY: HISTORICAL DATA (2012–2024)
- EXPORT PRICES BY COUNTRY: HISTORICAL DATA (2012–2024)
10. PROFILES OF MAJOR PRODUCERS
The Largest Producers on The Market and Their Profiles
LIST OF TABLES
- Key Findings In 2024
- Market Volume, In Physical Terms: Historical Data (2012–2024) and Forecast (2025–2035)
- Market Value: Historical Data (2012–2024) and Forecast (2025–2035)
- Per Capita Consumption: Historical Data (2012–2024) and Forecast (2025–2035)
- Imports, In Physical Terms, By Country, 2012–2024
- Imports, In Value Terms, By Country, 2012–2024
- Import Prices, By Country, 2012–2024
- Exports, In Physical Terms, By Country, 2012–2024
- Exports, In Value Terms, By Country, 2012–2024
- Export Prices, By Country, 2012–2024
LIST OF FIGURES
- Market Volume, In Physical Terms: Historical Data (2012–2024) and Forecast (2025–2035)
- Market Value: Historical Data (2012–2024) and Forecast (2025–2035)
- Market Structure – Domestic Supply vs. Imports, in Physical Terms: Historical Data (2012–2024) and Forecast (2025–2035)
- Market Structure – Domestic Supply vs. Imports, in Value Terms: Historical Data (2012–2024) and Forecast (2025–2035)
- Trade Balance, In Physical Terms: Historical Data (2012–2024) and Forecast (2025–2035)
- Trade Balance, In Value Terms: Historical Data (2012–2024) and Forecast (2025–2035)
- Per Capita Consumption: Historical Data (2012–2024) and Forecast (2025–2035)
- Market Volume Forecast to 2035
- Market Value Forecast to 2035
- Market Size and Growth, By Product
- Average Per Capita Consumption, By Product
- Exports and Growth, By Product
- Export Prices and Growth, By Product
- Production Volume and Growth
- Exports and Growth
- Export Prices and Growth
- Market Size and Growth
- Per Capita Consumption
- Imports and Growth
- Import Prices
- Production, In Physical Terms: Historical Data (2012–2024) and Forecast (2025–2035)
- Production, In Value Terms: Historical Data (2012–2024) and Forecast (2025–2035)
- Imports, In Physical Terms: Historical Data (2012–2024) and Forecast (2025–2035)
- Imports, In Value Terms: Historical Data (2012–2024) and Forecast (2025–2035)
- Imports, In Physical Terms, By Country, 2024
- Imports, In Physical Terms, By Country, 2012–2024
- Imports, In Value Terms, By Country, 2012–2024
- Import Prices, By Country, 2012–2024
- Exports, In Physical Terms: Historical Data (2012–2024) and Forecast (2025–2035)
- Exports, In Value Terms: Historical Data (2012–2024) and Forecast (2025–2035)
- Exports, In Physical Terms, By Country, 2024
- Exports, In Physical Terms, By Country, 2012–2024
- Exports, In Value Terms, By Country, 2012–2024
- Export Prices, By Country, 2012–2024


