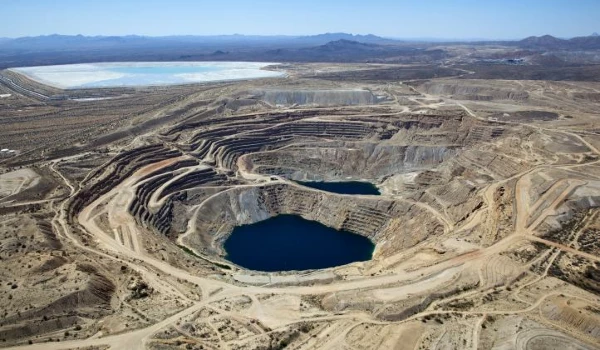
Marimaca Copper Expands Exploration in Chile with Promising Discovery
Marimaca Copper Corp (TSX: MARI) has announced the discovery of the northern extension of the Pampa Medina deposit, approximately 26km from its primary Marimaca Oxide Deposit (MOD) in Chile's Antofagasta region. For more details, you can read the full announcement here.
The discovery is part of Marimaca's ongoing efforts to advance the definitive feasibility study (DFS) for its flagship Marimaca copper asset. Recent drilling at the Pias target, located northwest of Pampa Medina, yielded notable results. Hole SMR-01, situated 400m north of the known northern extent of the Pampa Medina deposit, intersected significant mineralization from 272m to 650m. This includes 400m at 0.49% CuT from 250m, with an impressive high-grade section of 18m at 5.11% CuT from 320m.
In response to the discovery, the company plans to expand its exploration program at Pampa Medina Norte by 2025, aiming to test further extensions both laterally and at depth. This strategy reflects Marimaca's confidence in the area's potential for significant growth, further amplified by their recent acquisition of the Madrugador concessions.
Marimaca's stock saw a positive impact from these revelations, increasing by 4.7% during midday trading in Toronto, lifting the company's market capitalization to C$517 million ($360 million). The results promise to enhance the historical resource estimates, although exploration may delay updates as the company seeks to define the full scope of the mineral system.
This report provides an in-depth analysis of the market for copper ores and concentrates in Chile. Within it, you will discover the latest data on market trends and opportunities by country, consumption, production and price developments, as well as the global trade (imports and exports). The forecast exhibits the market prospects through 2030.
Product coverage:
- Prodcom 07291100 - Copper ores and concentrates
Country coverage:
- Chile
Data coverage:
- Market volume and value
- Per Capita consumption
- Forecast of the market dynamics in the medium term
- Trade (exports and imports) in Chile
- Export and import prices
- Market trends, drivers and restraints
- Key market players and their profiles
Reasons to buy this report:
- Take advantage of the latest data
- Find deeper insights into current market developments
- Discover vital success factors affecting the market
This report is designed for manufacturers, distributors, importers, and wholesalers, as well as for investors, consultants and advisors.
In this report, you can find information that helps you to make informed decisions on the following issues:
- How to diversify your business and benefit from new market opportunities
- How to load your idle production capacity
- How to boost your sales on overseas markets
- How to increase your profit margins
- How to make your supply chain more sustainable
- How to reduce your production and supply chain costs
- How to outsource production to other countries
- How to prepare your business for global expansion
While doing this research, we combine the accumulated expertise of our analysts and the capabilities of artificial intelligence. The AI-based platform, developed by our data scientists, constitutes the key working tool for business analysts, empowering them to discover deep insights and ideas from the marketing data.
1. INTRODUCTION
Making Data-Driven Decisions to Grow Your Business
- REPORT DESCRIPTION
- RESEARCH METHODOLOGY AND THE AI PLATFORM
- DATA-DRIVEN DECISIONS FOR YOUR BUSINESS
- GLOSSARY AND SPECIFIC TERMS
2. EXECUTIVE SUMMARY
A Quick Overview of Market Performance
- KEY FINDINGS
- MARKET TRENDSThis Chapter is Available Only for the Professional EditionPRO
3. MARKET OVERVIEW
Understanding the Current State of The Market and its Prospects
- MARKET SIZE: HISTORICAL DATA (2012–2024) AND FORECAST (2025–2035)
- MARKET STRUCTURE: HISTORICAL DATA (2012–2024) AND FORECAST (2025–2035)
- TRADE BALANCE: HISTORICAL DATA (2012–2024) AND FORECAST (2025–2035)
- PER CAPITA CONSUMPTION: HISTORICAL DATA (2012–2024) AND FORECAST (2025–2035)
- MARKET FORECAST TO 2035
4. MOST PROMISING PRODUCTS FOR DIVERSIFICATION
Finding New Products to Diversify Your Business
- TOP PRODUCTS TO DIVERSIFY YOUR BUSINESS
- BEST-SELLING PRODUCTS
- MOST CONSUMED PRODUCTS
- MOST TRADED PRODUCTS
- MOST PROFITABLE PRODUCTS FOR EXPORTS
5. MOST PROMISING SUPPLYING COUNTRIES
Choosing the Best Countries to Establish Your Sustainable Supply Chain
- TOP COUNTRIES TO SOURCE YOUR PRODUCT
- TOP PRODUCING COUNTRIES
- TOP EXPORTING COUNTRIES
- LOW-COST EXPORTING COUNTRIES
6. MOST PROMISING OVERSEAS MARKETS
Choosing the Best Countries to Boost Your Export
- TOP OVERSEAS MARKETS FOR EXPORTING YOUR PRODUCT
- TOP CONSUMING MARKETS
- UNSATURATED MARKETS
- TOP IMPORTING MARKETS
- MOST PROFITABLE MARKETS
7. PRODUCTION
The Latest Trends and Insights into The Industry
- PRODUCTION VOLUME AND VALUE: HISTORICAL DATA (2012–2024) AND FORECAST (2025–2035)
8. IMPORTS
The Largest Import Supplying Countries
- IMPORTS: HISTORICAL DATA (2012–2024) AND FORECAST (2025–2035)
- IMPORTS BY COUNTRY: HISTORICAL DATA (2012–2024)
- IMPORT PRICES BY COUNTRY: HISTORICAL DATA (2012–2024)
9. EXPORTS
The Largest Destinations for Exports
- EXPORTS: HISTORICAL DATA (2012–2024) AND FORECAST (2025–2035)
- EXPORTS BY COUNTRY: HISTORICAL DATA (2012–2024)
- EXPORT PRICES BY COUNTRY: HISTORICAL DATA (2012–2024)
10. PROFILES OF MAJOR PRODUCERS
The Largest Producers on The Market and Their Profiles
LIST OF TABLES
- Key Findings In 2024
- Market Volume, In Physical Terms: Historical Data (2012–2024) and Forecast (2025–2035)
- Market Value: Historical Data (2012–2024) and Forecast (2025–2035)
- Per Capita Consumption: Historical Data (2012–2024) and Forecast (2025–2035)
- Imports, In Physical Terms, By Country, 2012–2024
- Imports, In Value Terms, By Country, 2012–2024
- Import Prices, By Country, 2012–2024
- Exports, In Physical Terms, By Country, 2012–2024
- Exports, In Value Terms, By Country, 2012–2024
- Export Prices, By Country, 2012–2024
LIST OF FIGURES
- Market Volume, In Physical Terms: Historical Data (2012–2024) and Forecast (2025–2035)
- Market Value: Historical Data (2012–2024) and Forecast (2025–2035)
- Market Structure – Domestic Supply vs. Imports, in Physical Terms: Historical Data (2012–2024) and Forecast (2025–2035)
- Market Structure – Domestic Supply vs. Imports, in Value Terms: Historical Data (2012–2024) and Forecast (2025–2035)
- Trade Balance, In Physical Terms: Historical Data (2012–2024) and Forecast (2025–2035)
- Trade Balance, In Value Terms: Historical Data (2012–2024) and Forecast (2025–2035)
- Per Capita Consumption: Historical Data (2012–2024) and Forecast (2025–2035)
- Market Volume Forecast to 2035
- Market Value Forecast to 2035
- Market Size and Growth, By Product
- Average Per Capita Consumption, By Product
- Exports and Growth, By Product
- Export Prices and Growth, By Product
- Production Volume and Growth
- Exports and Growth
- Export Prices and Growth
- Market Size and Growth
- Per Capita Consumption
- Imports and Growth
- Import Prices
- Production, In Physical Terms: Historical Data (2012–2024) and Forecast (2025–2035)
- Production, In Value Terms: Historical Data (2012–2024) and Forecast (2025–2035)
- Imports, In Physical Terms: Historical Data (2012–2024) and Forecast (2025–2035)
- Imports, In Value Terms: Historical Data (2012–2024) and Forecast (2025–2035)
- Imports, In Physical Terms, By Country, 2024
- Imports, In Physical Terms, By Country, 2012–2024
- Imports, In Value Terms, By Country, 2012–2024
- Import Prices, By Country, 2012–2024
- Exports, In Physical Terms: Historical Data (2012–2024) and Forecast (2025–2035)
- Exports, In Value Terms: Historical Data (2012–2024) and Forecast (2025–2035)
- Exports, In Physical Terms, By Country, 2024
- Exports, In Physical Terms, By Country, 2012–2024
- Exports, In Value Terms, By Country, 2012–2024
- Export Prices, By Country, 2012–2024


