Price of Carrots and Turnips in Qatar Soars by 14% to $820 per Ton
Qatar Carrot And Turnip Import Price in June 2023
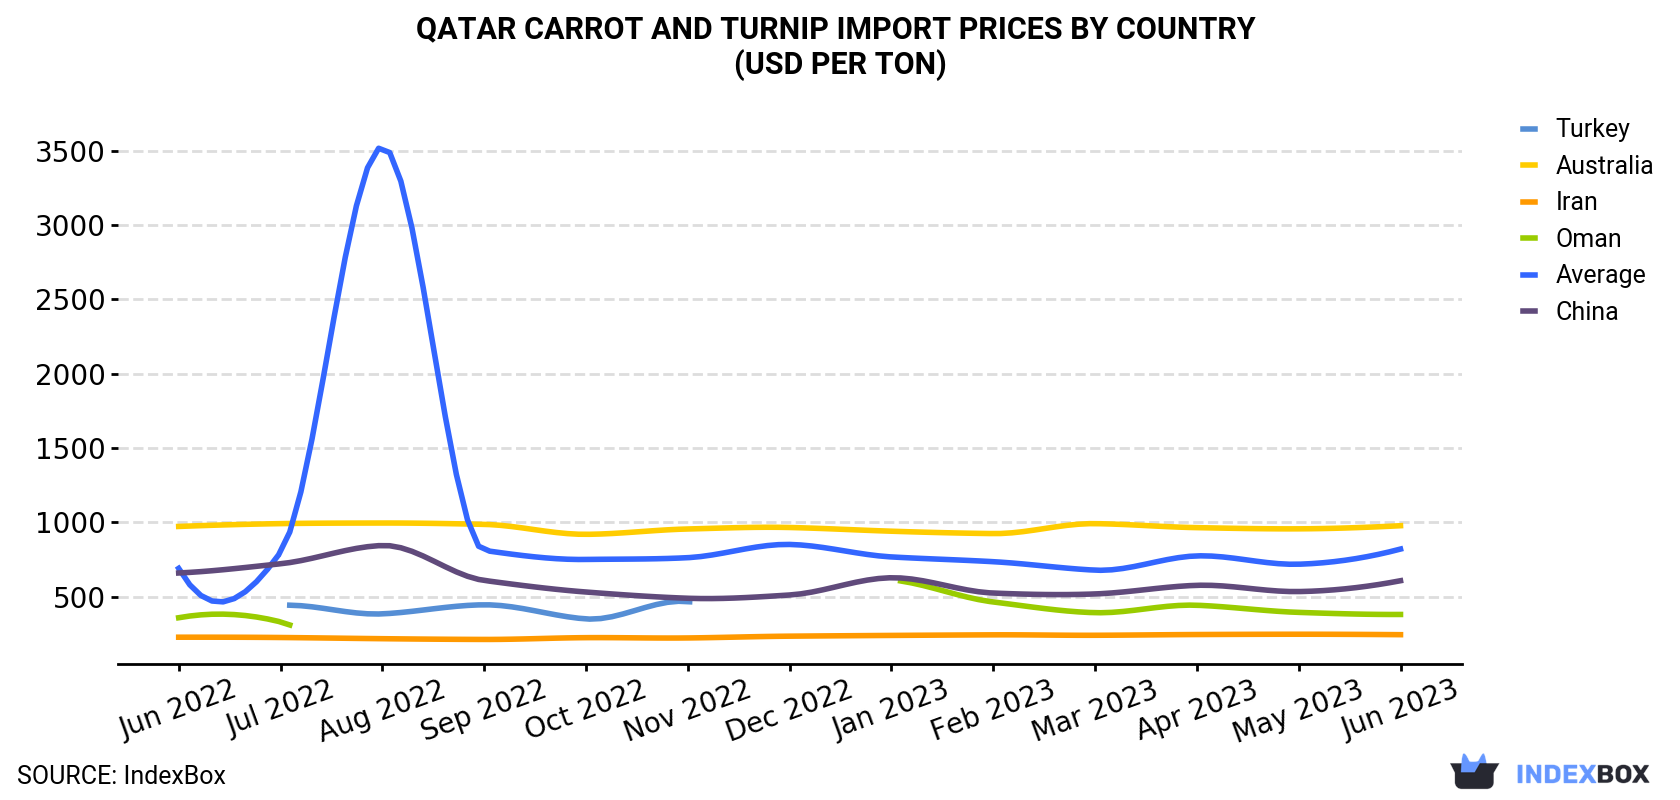
In June 2023, the carrot and turnip price stood at $820 per ton (CIF, Qatar), growing by 14% against the previous month. In general, the import price posted modest growth. The most prominent rate of growth was recorded in August 2022 an increase of 341% m-o-m. As a result, import price attained the peak level of $3,526 per ton. From September 2022 to June 2023, the average import prices remained at a lower figure.
Prices varied noticeably by the country of origin: the country with the highest price was Australia ($977 per ton), while the price for Iran ($244 per ton) was amongst the lowest.
From June 2022 to June 2023, the most notable rate of growth in terms of prices was attained by Turkey (+1.4%), while the prices for the other major suppliers experienced more modest paces of growth.
| COUNTRY | Import Price of Carrot And Turnip in Qatar (USD per ton) | ||||||||||||
|---|---|---|---|---|---|---|---|---|---|---|---|---|---|
| Jun 2022 | Jul 2022 | Aug 2022 | Sep 2022 | Oct 2022 | Nov 2022 | Dec 2022 | Jan 2023 | Feb 2023 | Mar 2023 | Apr 2023 | May 2023 | Jun 2023 | |
| Australia | 972 | 991 | 995 | 986 | 919 | 955 | 965 | 940 | 924 | 991 | 964 | 956 | 977 |
| China | 659 | 721 | 844 | 609 | 531 | 489 | 511 | 627 | 524 | 518 | 576 | 534 | 607 |
| Oman | 358 | 330 | N/A | N/A | N/A | N/A | N/A | 613 | 464 | 392 | 442 | 394 | 380 |
| Iran | 227 | 225 | 217 | 212 | 224 | 222 | 234 | 239 | 243 | 240 | 245 | 247 | 244 |
| Turkey | N/A | 441 | 384 | 445 | 350 | 467 | N/A | N/A | N/A | N/A | N/A | N/A | N/A |
| Average | 690 | 799 | 3,526 | 811 | 750 | 762 | 851 | 767 | 735 | 678 | 774 | 718 | 820 |
Qatar Carrot And Turnip Imports
In June 2023, supplies from abroad of carrots and turnips was finally on the rise to reach 1.6K tons after two months of decline. In general, imports, however, recorded a relatively flat trend pattern. The pace of growth was the most pronounced in August 2022 with an increase of 30% m-o-m.
In value terms, carrot and turnip imports surged to $1.3M (IndexBox estimates) in June 2023. Overall, imports saw a relatively flat trend pattern. The pace of growth appeared the most rapid in August 2022 with an increase of 472% against the previous month. As a result, imports attained the peak of $6.7M. From September 2022 to June 2023, the growth of imports remained at a lower figure.
Qatar Carrot And Turnip Imports by Country
Australia (651 tons), China (634 tons) and Iran (113 tons) were the main suppliers of carrot and turnip imports to Qatar, together comprising 88% of total imports.
From June 2022 to June 2023, the most notable rate of growth in terms of purchases, amongst the main suppliers, was attained by China (with a CAGR of +13.9%), while imports for the other leaders experienced a decline.
In value terms, Australia ($636K), China ($385K) and Oman ($37K) constituted the largest carrot and turnip suppliers to Qatar, with a combined 81% share of total imports.
China, with a CAGR of +13.2%, recorded the highest growth rate of the value of imports, in terms of the main suppliers over the period under review, while purchases for the other leaders experienced a decline.
-
1. INTRODUCTION
Making Data-Driven Decisions to Grow Your Business
- REPORT DESCRIPTION
- RESEARCH METHODOLOGY AND THE AI PLATFORM
- DATA-DRIVEN DECISIONS FOR YOUR BUSINESS
- GLOSSARY AND SPECIFIC TERMS
-
2. EXECUTIVE SUMMARY
A Quick Overview of Market Performance
- KEY FINDINGS
- MARKET TRENDS This Chapter is Available Only for the Professional EditionPRO
-
3. MARKET OVERVIEW
Understanding the Current State of The Market and its Prospects
- MARKET SIZE: HISTORICAL DATA (2012–2024) AND FORECAST (2025–2035)
- MARKET STRUCTURE: HISTORICAL DATA (2012–2024) AND FORECAST (2025–2035)
- TRADE BALANCE: HISTORICAL DATA (2012–2024) AND FORECAST (2025–2035)
- PER CAPITA CONSUMPTION: HISTORICAL DATA (2012–2024) AND FORECAST (2025–2035)
- MARKET FORECAST TO 2035
-
4. MOST PROMISING PRODUCTS FOR DIVERSIFICATION
Finding New Products to Diversify Your Business
- TOP PRODUCTS TO DIVERSIFY YOUR BUSINESS
- BEST-SELLING PRODUCTS
- MOST CONSUMED PRODUCTS
- MOST TRADED PRODUCTS
- MOST PROFITABLE PRODUCTS FOR EXPORTS
-
5. MOST PROMISING SUPPLYING COUNTRIES
Choosing the Best Countries to Establish Your Sustainable Supply Chain
- TOP COUNTRIES TO SOURCE YOUR PRODUCT
- TOP PRODUCING COUNTRIES
- COUNTRIES WITH TOP YIELDS
- TOP EXPORTING COUNTRIES
- LOW-COST EXPORTING COUNTRIES
-
6. MOST PROMISING OVERSEAS MARKETS
Choosing the Best Countries to Boost Your Export
- TOP OVERSEAS MARKETS FOR EXPORTING YOUR PRODUCT
- TOP CONSUMING MARKETS
- UNSATURATED MARKETS
- TOP IMPORTING MARKETS
- MOST PROFITABLE MARKETS
-
7. PRODUCTION
The Latest Trends and Insights into The Industry
- PRODUCTION VOLUME AND VALUE: HISTORICAL DATA (2012–2024) AND FORECAST (2025–2035)
-
8. IMPORTS
The Largest Import Supplying Countries
- IMPORTS: HISTORICAL DATA (2012–2024) AND FORECAST (2025–2035)
- IMPORTS BY COUNTRY: HISTORICAL DATA (2012–2024)
- IMPORT PRICES BY COUNTRY: HISTORICAL DATA (2012–2024)
-
9. EXPORTS
The Largest Destinations for Exports
- EXPORTS: HISTORICAL DATA (2012–2024) AND FORECAST (2025–2035)
- EXPORTS BY COUNTRY: HISTORICAL DATA (2012–2024)
- EXPORT PRICES BY COUNTRY: HISTORICAL DATA (2012–2024)
-
10. PROFILES OF MAJOR PRODUCERS
The Largest Producers on The Market and Their Profiles
-
LIST OF TABLES
- Key Findings In 2024
- Market Volume, In Physical Terms: Historical Data (2012–2024) and Forecast (2025–2035)
- Market Value: Historical Data (2012–2024) and Forecast (2025–2035)
- Per Capita Consumption: Historical Data (2012–2024) and Forecast (2025–2035)
- Imports, In Physical Terms, By Country, 2012-2024
- Imports, In Value Terms, By Country, 2012-2024
- Import Prices, By Country, 2012-2024
- Exports, In Physical Terms, By Country, 2012-2024
- Exports, In Value Terms, By Country, 2012-2024
- Exports Prices, By Country, 2012-2024
-
LIST OF FIGURES
- Market Volume, in Physical Terms: Historical Data (2012–2024) and Forecast (2025–2035)
- Market Value: Historical Data (2012–2024) and Forecast (2025–2035)
- Market Structure – Domestic Supply Vs. Imports, in Physical Terms: Historical Data (2012–2024) and Forecast (2025–2035)
- Market Structure – Domestic Supply Vs. Imports, in Value Terms: Historical Data (2012–2024) and Forecast (2025–2035)
- Trade Balance, in Physical Terms: Historical Data (2012–2024) and Forecast (2025–2035)
- Trade Balance, in Value Terms: Historical Data (2012–2024) and Forecast (2025–2035)
- Per Capita Consumption: Historical Data (2012–2024) and Forecast (2025–2035)
- Market Volume Forecast to 2035
- Market Value Forecast to 2035
- Market Size and Growth, by Product
- Average Per Capita Consumption, by Product
- Exports and Growth, by Product
- Export Prices and Growth, by Product
- Production Volume and Growth
- Yield and Growth
- Exports and Growth
- Export Prices and Growth
- Market Size and Growth
- Per Capita Consumption
- Imports and Growth
- Import Prices
- Production, in Physical Terms: Historical Data (2012–2024) and Forecast (2025–2035)
- Production, in Value Terms: Historical Data (2012–2024) and Forecast (2025–2035)
- Harvested Area: Historical Data (2012–2024) and Forecast (2025–2035)
- Yield: Historical Data (2012–2024) and Forecast (2025–2035)
- Imports, in Physical Terms: Historical Data (2012–2024) and Forecast (2025–2035)
- Imports, in Value Terms: Historical Data (2012–2024) and Forecast (2025–2035)
- Imports, in Physical Terms, by Country, 2024
- Imports, in Physical Terms, by Country, 2012-2024
- Imports, in Value Terms, by Country, 2012-2024
- Import Prices, by Country, 2012-2024
- Exports, in Physical Terms: Historical Data (2012–2024) and Forecast (2025–2035)
- Exports, in Value Terms: Historical Data (2012–2024) and Forecast (2025–2035)
- Exports, in Physical Terms, by Country, 2024
- Exports, in Physical Terms, by Country, 2012-2024
- Exports, in Value Terms, by Country, 2012-2024
- Export Prices, by Country, 2012-2024


