
Qatar - Chicken Meat - Market Analysis, Forecast, Size, Trends and Insights
Get instant access to more than 2 million reports, dashboards, and datasets on the IndexBox Platform.
View PricingQatar's Chicken Meat Hits Rock-bottom at $1,873 per Ton
Qatar Chicken Meat Import Price in June 2023
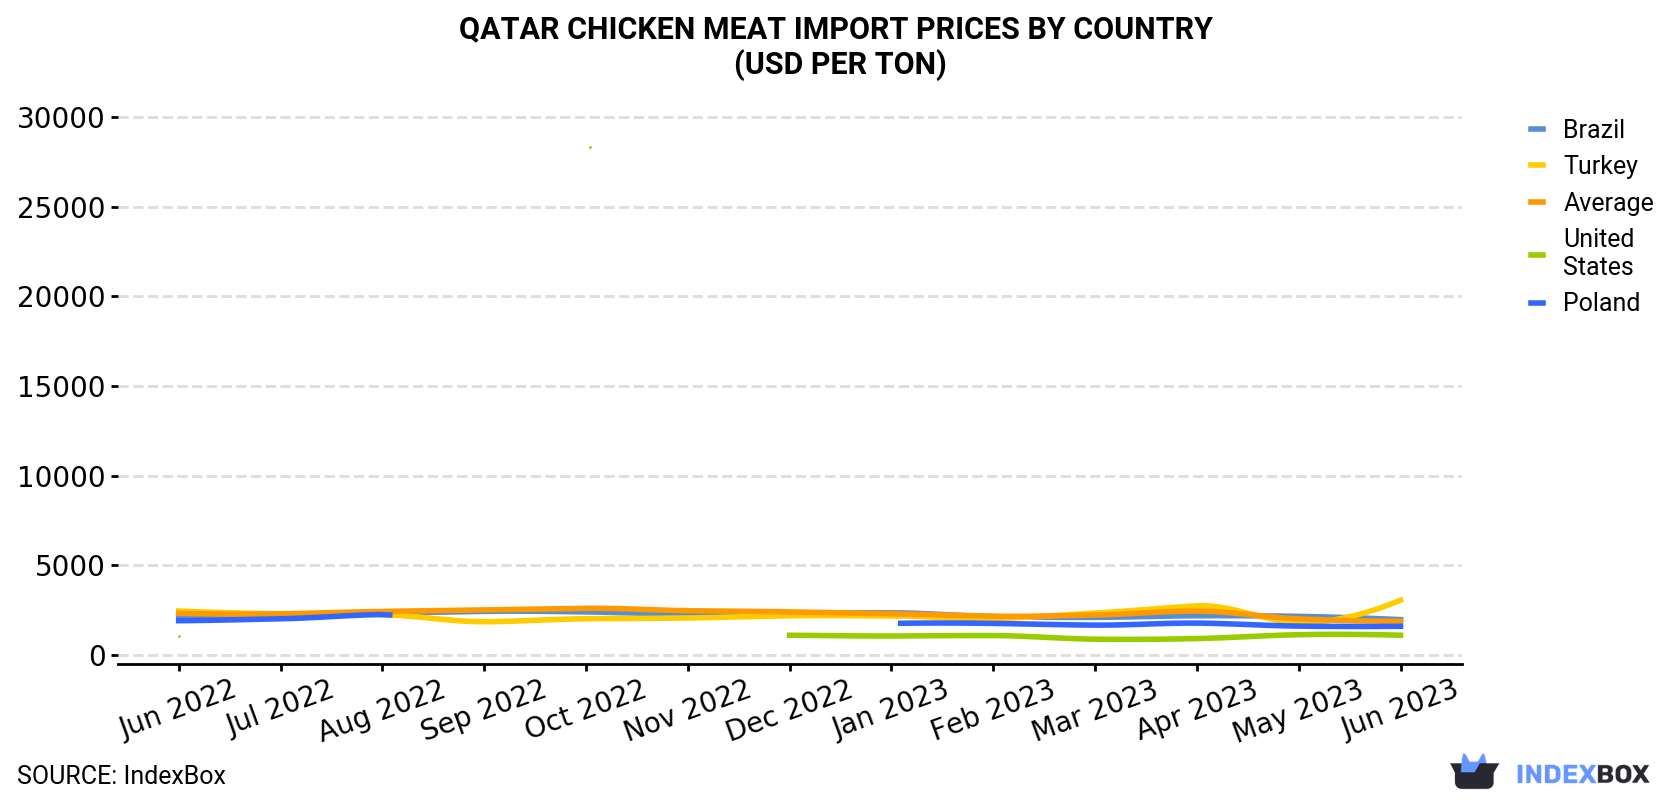
In June 2023, the chicken meat price amounted to $1,873 per ton (CIF, Qatar), falling by -6.8% against the previous month. Overall, the import price recorded a mild slump. The pace of growth appeared the most rapid in April 2023 when the average import price increased by 10% against the previous month. Over the period under review, average import prices attained the maximum at $2,594 per ton in October 2022; however, from November 2022 to June 2023, import prices remained at a lower figure.
There were significant differences in the average prices amongst the major supplying countries. In June 2023, the country with the highest price was Turkey ($3,048 per ton), while the price for the United States ($1,097 per ton) was amongst the lowest.
From June 2022 to June 2023, the most notable rate of growth in terms of prices was attained by Turkey (+1.9%), while the prices for the other major suppliers experienced mixed trend patterns.
| COUNTRY | Import Price of Chicken Meat in Qatar (USD per ton) | ||||||||||||
|---|---|---|---|---|---|---|---|---|---|---|---|---|---|
| Jun 2022 | Jul 2022 | Aug 2022 | Sep 2022 | Oct 2022 | Nov 2022 | Dec 2022 | Jan 2023 | Feb 2023 | Mar 2023 | Apr 2023 | May 2023 | Jun 2023 | |
| Turkey | 2,446 | 2,278 | 2,241 | 1,850 | 2,016 | 2,060 | 2,176 | 2,172 | 2,030 | 2,329 | 2,736 | 1,805 | 3,048 |
| Brazil | 2,172 | 2,195 | 2,318 | 2,427 | 2,397 | 2,275 | 2,319 | 2,345 | 2,133 | 2,093 | 2,181 | 2,147 | 1,966 |
| Poland | 1,906 | 2,013 | 2,255 | N/A | N/A | N/A | N/A | 1,755 | 1,755 | 1,660 | 1,772 | 1,606 | 1,596 |
| United States | 1,057 | N/A | N/A | N/A | 28,423 | N/A | 1,094 | 1,053 | 1,077 | 876 | 909 | 1,125 | 1,097 |
| Average | 2,314 | 2,288 | 2,423 | 2,508 | 2,594 | 2,464 | 2,397 | 2,293 | 2,160 | 2,223 | 2,445 | 2,008 | 1,873 |
Qatar Chicken Meat Import Prices by Type
Prices varied noticeably by the product type; the product with the highest price was fresh or chilled whole chickens ($100K per ton), while the price for frozen cuts of chicken ($1,807 per ton) was amongst the lowest.
From June 2022 to June 2023, the most notable rate of growth in terms of prices was attained by fresh whole chicken (+9.4%), while the prices for the other products experienced mixed trend patterns.
Qatar Chicken Meat Imports
In June 2023, approximately 11K tons of chicken meat were imported into Qatar; picking up by 8.4% on May 2023 figures. Overall, imports recorded a relatively flat trend pattern. The pace of growth was the most pronounced in May 2023 with an increase of 192% against the previous month.
In value terms, chicken meat imports reached $21M (IndexBox estimates) in June 2023. In general, imports, however, saw a mild decrease. The growth pace was the most rapid in May 2023 with an increase of 140% against the previous month.
Qatar Chicken Meat Imports by Type
Frozen whole chickens (5.9K tons), frozen cuts of chicken (5.4K tons) and fresh or chilled cuts of chicken (42 tons) were the main products of chicken meat imports to Qatar, with a combined 99.9% share of total imports. Fresh or chilled whole chickens lagged somewhat behind, comprising a further less than 0.1%.
From June 2022 to June 2023, the most notable rate of growth in terms of purchases, amongst the major product types, was attained by fresh chicken cut (with a CAGR of +12.6%), while imports for the other products experienced more modest paces of growth.
In value terms, the most traded types of chicken meat in Qatar were frozen whole chickens ($11M), frozen cuts of chicken ($9.8M) and fresh or chilled cuts of chicken ($443K), with a combined 99% share of total imports. These products were followed by fresh or chilled whole chickens, which accounted for a further 0.6%.
Qatar Chicken Meat Imports by Country
In June 2023, Brazil (6.8K tons) constituted the largest chicken meat supplier to Qatar, accounting for a 59% share of total imports. Moreover, chicken meat imports from Brazil exceeded the figures recorded by the second-largest supplier, the United States (3K tons), twofold. The third position in this ranking was held by Poland (727 tons), with a 6.4% share.
From June 2022 to June 2023, the average monthly growth rate of volume from Brazil was relatively modest. The remaining supplying countries recorded the following average monthly rates of imports growth: the United States (+25.9% per month) and Poland (-6.8% per month).
In value terms, Brazil ($13M) constituted the largest supplier of chicken meat to Qatar, comprising 62% of total imports. The second position in the ranking was held by the United States ($3.3M), with a 15% share of total imports. It was followed by Poland, with a 5.4% share.
From June 2022 to June 2023, the average monthly rate of growth in terms of value from Brazil amounted to -1.3%. The remaining supplying countries recorded the following average monthly rates of imports growth: the United States (+26.3% per month) and Poland (-8.2% per month).
This report provides an in-depth analysis of the chicken meat market in Qatar. Within it, you will discover the latest data on market trends and opportunities by country, consumption, production and price developments, as well as the global trade (imports and exports). The forecast exhibits the market prospects through 2030.
Product coverage:
- FCL 1058 - Chicken meat
- FCL 1059 - Offals and liver of chickens
Country coverage:
- Qatar
Data coverage:
- Market volume and value
- Per Capita consumption
- Forecast of the market dynamics in the medium term
- Trade (exports and imports) in Qatar
- Export and import prices
- Market trends, drivers and restraints
- Key market players and their profiles
Reasons to buy this report:
- Take advantage of the latest data
- Find deeper insights into current market developments
- Discover vital success factors affecting the market
This report is designed for manufacturers, distributors, importers, and wholesalers, as well as for investors, consultants and advisors.
In this report, you can find information that helps you to make informed decisions on the following issues:
- How to diversify your business and benefit from new market opportunities
- How to load your idle production capacity
- How to boost your sales on overseas markets
- How to increase your profit margins
- How to make your supply chain more sustainable
- How to reduce your production and supply chain costs
- How to outsource production to other countries
- How to prepare your business for global expansion
While doing this research, we combine the accumulated expertise of our analysts and the capabilities of artificial intelligence. The AI-based platform, developed by our data scientists, constitutes the key working tool for business analysts, empowering them to discover deep insights and ideas from the marketing data.
-
1. INTRODUCTION
Making Data-Driven Decisions to Grow Your Business
- REPORT DESCRIPTION
- RESEARCH METHODOLOGY AND THE AI PLATFORM
- DATA-DRIVEN DECISIONS FOR YOUR BUSINESS
- GLOSSARY AND SPECIFIC TERMS
-
2. EXECUTIVE SUMMARY
A Quick Overview of Market Performance
- KEY FINDINGS
- MARKET TRENDS This Chapter is Available Only for the Professional EditionPRO
-
3. MARKET OVERVIEW
Understanding the Current State of The Market and its Prospects
- MARKET SIZE: HISTORICAL DATA (2012–2024) AND FORECAST (2025–2035)
- MARKET STRUCTURE: HISTORICAL DATA (2012–2024) AND FORECAST (2025–2035)
- TRADE BALANCE: HISTORICAL DATA (2012–2024) AND FORECAST (2025–2035)
- PER CAPITA CONSUMPTION: HISTORICAL DATA (2012–2024) AND FORECAST (2025–2035)
- MARKET FORECAST TO 2035
-
4. MOST PROMISING PRODUCTS FOR DIVERSIFICATION
Finding New Products to Diversify Your Business
- TOP PRODUCTS TO DIVERSIFY YOUR BUSINESS
- BEST-SELLING PRODUCTS
- MOST CONSUMED PRODUCTS
- MOST TRADED PRODUCTS
- MOST PROFITABLE PRODUCTS FOR EXPORTS
-
5. MOST PROMISING SUPPLYING COUNTRIES
Choosing the Best Countries to Establish Your Sustainable Supply Chain
- TOP COUNTRIES TO SOURCE YOUR PRODUCT
- TOP PRODUCING COUNTRIES
- COUNTRIES WITH TOP YIELDS
- TOP EXPORTING COUNTRIES
- LOW-COST EXPORTING COUNTRIES
-
6. MOST PROMISING OVERSEAS MARKETS
Choosing the Best Countries to Boost Your Export
- TOP OVERSEAS MARKETS FOR EXPORTING YOUR PRODUCT
- TOP CONSUMING MARKETS
- UNSATURATED MARKETS
- TOP IMPORTING MARKETS
- MOST PROFITABLE MARKETS
-
7. PRODUCTION
The Latest Trends and Insights into The Industry
- PRODUCTION VOLUME AND VALUE: HISTORICAL DATA (2012–2024) AND FORECAST (2025–2035)
-
8. IMPORTS
The Largest Import Supplying Countries
- IMPORTS: HISTORICAL DATA (2012–2024) AND FORECAST (2025–2035)
- IMPORTS BY COUNTRY: HISTORICAL DATA (2012–2024)
- IMPORT PRICES BY COUNTRY: HISTORICAL DATA (2012–2024)
-
9. EXPORTS
The Largest Destinations for Exports
- EXPORTS: HISTORICAL DATA (2012–2024) AND FORECAST (2025–2035)
- EXPORTS BY COUNTRY: HISTORICAL DATA (2012–2024)
- EXPORT PRICES BY COUNTRY: HISTORICAL DATA (2012–2024)
-
10. PROFILES OF MAJOR PRODUCERS
The Largest Producers on The Market and Their Profiles
-
LIST OF TABLES
- Key Findings In 2024
- Market Volume, In Physical Terms: Historical Data (2012–2024) and Forecast (2025–2035)
- Market Value: Historical Data (2012–2024) and Forecast (2025–2035)
- Per Capita Consumption: Historical Data (2012–2024) and Forecast (2025–2035)
- Imports, In Physical Terms, By Country, 2012-2024
- Imports, In Value Terms, By Country, 2012-2024
- Import Prices, By Country, 2012-2024
- Exports, In Physical Terms, By Country, 2012-2024
- Exports, In Value Terms, By Country, 2012-2024
- Exports Prices, By Country, 2012-2024
-
LIST OF FIGURES
- Market Volume, in Physical Terms: Historical Data (2012–2024) and Forecast (2025–2035)
- Market Value: Historical Data (2012–2024) and Forecast (2025–2035)
- Market Structure – Domestic Supply Vs. Imports, in Physical Terms: Historical Data (2012–2024) and Forecast (2025–2035)
- Market Structure – Domestic Supply Vs. Imports, in Value Terms: Historical Data (2012–2024) and Forecast (2025–2035)
- Trade Balance, in Physical Terms: Historical Data (2012–2024) and Forecast (2025–2035)
- Trade Balance, in Value Terms: Historical Data (2012–2024) and Forecast (2025–2035)
- Per Capita Consumption: Historical Data (2012–2024) and Forecast (2025–2035)
- Market Volume Forecast to 2035
- Market Value Forecast to 2035
- Market Size and Growth, by Product
- Average Per Capita Consumption, by Product
- Exports and Growth, by Product
- Export Prices and Growth, by Product
- Production Volume and Growth
- Yield and Growth
- Exports and Growth
- Export Prices and Growth
- Market Size and Growth
- Per Capita Consumption
- Imports and Growth
- Import Prices
- Production, in Physical Terms: Historical Data (2012–2024) and Forecast (2025–2035)
- Production, in Value Terms: Historical Data (2012–2024) and Forecast (2025–2035)
- Producing Animals: Historical Data (2012–2024) and Forecast (2025–2035)
- Yield: Historical Data (2012–2024) and Forecast (2025–2035)
- Imports, in Physical Terms: Historical Data (2012–2024) and Forecast (2025–2035)
- Imports, in Value Terms: Historical Data (2012–2024) and Forecast (2025–2035)
- Imports, in Physical Terms, by Country, 2024
- Imports, in Physical Terms, by Country, 2012-2024
- Imports, in Value Terms, by Country, 2012-2024
- Import Prices, by Country, 2012-2024
- Exports, in Physical Terms: Historical Data (2012–2024) and Forecast (2025–2035)
- Exports, in Value Terms: Historical Data (2012–2024) and Forecast (2025–2035)
- Exports, in Physical Terms, by Country, 2024
- Exports, in Physical Terms, by Country, 2012-2024
- Exports, in Value Terms, by Country, 2012-2024
- Export Prices, by Country, 2012-2024


