U.S. Roasted Nuts And Peanut Butter Market. Analysis And Forecast to 2030
Get instant access to more than 2 million reports, dashboards, and datasets on the IndexBox Platform.
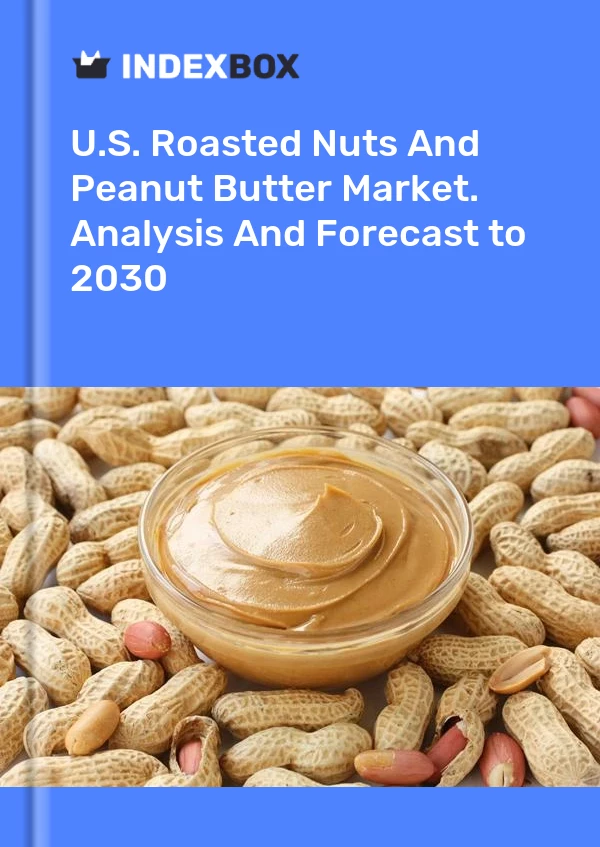
View PricingRoasted Nut and Peanut Butter Market in the USA - Key Insights
IndexBox has just published a new report, the U.S. Roasted Nuts And Peanut Butter Market. Analysis And Forecast to 2025. Here is a summary of the report's key findings.
The revenue of the market of roasted nuts and peanut butter in the U.S. amounted to $X in 2018, picking up by X% against the previous year. This figure reflects the total revenues of producers and importers (excluding logistics costs, retail marketing costs, and retailers' margins, which will be included in the final consumer price). The market value increased at an average annual rate of +X% from 2013 to 2018; however, the trend pattern indicated some noticeable fluctuations being recorded in certain years. The most prominent rate of growth was recorded in 2014, with an increase of X% year-to-year. Consumption of roasted nuts and peanut butter peaked in 2018, and is likely to continue its growth in the immediate term.
Production of Roasted Nuts And Peanut Butter in the USA
In value terms, production of roasted nuts and peanut butter stood at $X in 2018. The total output value increased at an average annual rate of +X% from 2013 to 2018, fluctuating slightly in certain years.
Nuts and seeds (salted, roasted, cooked, or blanched) ($X) constituted the leading product category in terms of the total output. The second position in the ranking was occupied by peanut butter ($X).
From 2013 to 2018, the average annual rate of growth of the production volume of nuts and seeds (salted, roasted, cooked, or blanched) stood at +X%. Meanwhile, production of peanut butter (-X% per year) contracted over the same period.
Exports of Roasted Nuts And Peanut ButterExports from the USA
In 2018, approx. X tons of roasted nuts and peanut butter were exported from the U.S.; increasing by X% against the previous year. In general, the total exports indicated a tangible growth from 2013 to 2018: its volume increased at an average annual rate of +X% over the last five year period. The trend pattern, however, indicated some noticeable fluctuations being recorded throughout the analyzed period. In value terms, exports of roasted nuts and peanut butter amounted to $X (IndexBox estimates) in 2018.
Exports by Country
China (X tons), Taiwan, Chinese (X tons) and China, Hong Kong SAR (X tons) were the main destinations of exports of roasted nuts and peanut butter from the U.S., together accounting for X% of total exports.
From 2013 to 2018, the most notable rate of growth in terms of exports, amongst the main countries of destination, was attained by China (+X% per year), while the other leaders experienced more modest paces of growth.
In value terms, China ($X), China, Hong Kong SAR ($X) and Australia ($X) were the largest markets for roasted nut and peanut butter exported from the U.S.
Export Prices by Country
In 2018, the average export price for roasted nuts and peanut butter amounted to $X per kg, picking up by X% against the previous year. Over the last five year period, it increased at an average annual rate of +X%.
There were significant differences in the average export prices for the major foreign markets. In 2018, the country with the highest export price was Australia ($X per kg), while the average price for exports to Taiwan, Chinese ($X per kg) was amongst the lowest.
From 2013 to 2018, the most notable rate of growth in terms of export prices was recorded for supplies to Australia (+X% per year), while the export prices for the other major destinations experienced more modest paces of growth.
Imports of Roasted Nuts And Peanut ButterImports into the USA
In 2018, imports of roasted nuts and peanut butter into the U.S. stood at X tons, shrinking by -X% against the previous year. Overall, imports of roasted nuts and peanut butter continue to indicate a strong increase.
In value terms, imports of roasted nuts and peanut butter stood at $X (IndexBox estimates) in 2018. The total import value increased at an average annual rate of +X% over the period from 2013 to 2018; moreover, imports peaked in 2018, and are expected to retain its growth in the near future.
Imports by Country
Argentina (X tons), China (X tons) and Israel (X tons) were the main suppliers of roasted nuts and peanut butter to the U.S., together comprising X% of total imports. These countries were followed by Vietnam, India, Thailand and Turkey, which together accounted for a further X%.
From 2013 to 2018, the most notable rate of growth in terms of imports, amongst the main suppliers, was attained by Vietnam (+X% per year), while the other leaders experienced more modest paces of growth.
In value terms, the largest roasted nut and peanut butter suppliers to the U.S. were Vietnam ($X), Thailand ($X) and China ($X), together accounting for X% of total imports.
Import Prices by Country
The average import price for roasted nuts and peanut butter stood at $X per kg in 2018, increasing by X% against the previous year. Overall, the import price for roasted nuts and peanut butter continues to indicate a relatively flat trend pattern.
Import prices varied noticeably by the country of origin; the country with the highest import price was Thailand ($X per kg), while the price for Argentina ($X per kg) was amongst the lowest.
From 2013 to 2018, the most notable rate of growth in terms of import prices was attained by Vietnam (+X% per year), while the import prices for the other major suppliers experienced mixed trend patterns.
Companies Mentioned in the Report
Diamond Foods, Wonderful Pistachios & Almonds, John B. Sanfilippo & Son, Stewart & Jasper Marketing, Bergin Fruit Company, Trophy Nut, Hazelnut Growers of Oregon, Algood Food Company, Kanan Enterprises, Texoma Peanut Company, Terri Lynn, A. L. Schutzman Company, Suntree, Star Snacks Co., Sahale Snacks, Sahale Snacks, Primex Farms, Ann's House of Nuts, Nutcracker Brands, Nichols Pistachio, Westnut, Mauna Loa Macadamia Nut, Bazzini Holdings, ABC Peanut Butter, Whitsons Food Service (bronx)
This report provides an in-depth analysis of the market for roasted nut and peanut butter in the U.S.. Within it, you will discover the latest data on market trends and opportunities by country, consumption, production and price developments, as well as the global trade (imports and exports). The forecast exhibits the market prospects through 2030.
Product coverage:
- NAICS 311911 - Roasted nuts and peanut butter manufacturing
Companies mentioned:
- Diamond Foods
- Wonderful Pistachios & Almonds
- John B. Sanfilippo & Son
- Stewart & Jasper Marketing
- Bergin Fruit Company
- Trophy Nut
- Hazelnut Growers of Oregon
- Algood Food Company
- Kanan Enterprises
- Texoma Peanut Company
- Terri Lynn
- A. L. Schutzman Company
- Suntree
- Star Snacks Co.
- Sahale Snacks
- Sahale Snacks
- Primex Farms
- Ann's House of Nuts
- Nutcracker Brands
- Nichols Pistachio
- Westnut
- Mauna Loa Macadamia Nut
- Bazzini Holdings
- ABC Peanut Butter
- Whitsons Food Service (bronx)
Country coverage:
- United States
Data coverage:
- Market volume and value
- Per Capita consumption
- Forecast of the market dynamics in the medium term
- Trade (exports and imports) in the U.S.
- Export and import prices
- Market trends, drivers and restraints
- Key market players and their profiles
Reasons to buy this report:
- Take advantage of the latest data
- Find deeper insights into current market developments
- Discover vital success factors affecting the market
This report is designed for manufacturers, distributors, importers, and wholesalers, as well as for investors, consultants and advisors.
In this report, you can find information that helps you to make informed decisions on the following issues:
- How to diversify your business and benefit from new market opportunities
- How to load your idle production capacity
- How to boost your sales on overseas markets
- How to increase your profit margins
- How to make your supply chain more sustainable
- How to reduce your production and supply chain costs
- How to outsource production to other countries
- How to prepare your business for global expansion
While doing this research, we combine the accumulated expertise of our analysts and the capabilities of artificial intelligence. The AI-based platform, developed by our data scientists, constitutes the key working tool for business analysts, empowering them to discover deep insights and ideas from the marketing data.
1. INTRODUCTION
Making Data-Driven Decisions to Grow Your Business
- REPORT DESCRIPTION
- RESEARCH METHODOLOGY AND THE AI PLATFORM
- DATA-DRIVEN DECISIONS FOR YOUR BUSINESS
- GLOSSARY AND SPECIFIC TERMS
2. EXECUTIVE SUMMARY
A Quick Overview of Market Performance
- KEY FINDINGS
- MARKET TRENDSThis Chapter is Available Only for the Professional EditionPRO
3. MARKET OVERVIEW
Understanding the Current State of The Market and its Prospects
- MARKET SIZE: HISTORICAL DATA (2012–2024) AND FORECAST (2025–2035)
- MARKET STRUCTURE: HISTORICAL DATA (2012–2024) AND FORECAST (2025–2035)
- TRADE BALANCE: HISTORICAL DATA (2012–2024) AND FORECAST (2025–2035)
- PER CAPITA CONSUMPTION: HISTORICAL DATA (2012–2024) AND FORECAST (2025–2035)
- MARKET FORECAST TO 2035
4. MOST PROMISING PRODUCTS FOR DIVERSIFICATION
Finding New Products to Diversify Your Business
- TOP PRODUCTS TO DIVERSIFY YOUR BUSINESS
- BEST-SELLING PRODUCTS
- MOST CONSUMED PRODUCTS
- MOST TRADED PRODUCTS
- MOST PROFITABLE PRODUCTS FOR EXPORTS
5. MOST PROMISING SUPPLYING COUNTRIES
Choosing the Best Countries to Establish Your Sustainable Supply Chain
- TOP COUNTRIES TO SOURCE YOUR PRODUCT
- TOP PRODUCING COUNTRIES
- TOP EXPORTING COUNTRIES
- LOW-COST EXPORTING COUNTRIES
6. MOST PROMISING OVERSEAS MARKETS
Choosing the Best Countries to Boost Your Export
- TOP OVERSEAS MARKETS FOR EXPORTING YOUR PRODUCT
- TOP CONSUMING MARKETS
- UNSATURATED MARKETS
- TOP IMPORTING MARKETS
- MOST PROFITABLE MARKETS
7. PRODUCTION
The Latest Trends and Insights into The Industry
- PRODUCTION VOLUME AND VALUE: HISTORICAL DATA (2012–2024) AND FORECAST (2025–2035)
8. IMPORTS
The Largest Import Supplying Countries
- IMPORTS: HISTORICAL DATA (2012–2024) AND FORECAST (2025–2035)
- IMPORTS BY COUNTRY: HISTORICAL DATA (2012–2024)
- IMPORT PRICES BY COUNTRY: HISTORICAL DATA (2012–2024)
9. EXPORTS
The Largest Destinations for Exports
- EXPORTS: HISTORICAL DATA (2012–2024) AND FORECAST (2025–2035)
- EXPORTS BY COUNTRY: HISTORICAL DATA (2012–2024)
- EXPORT PRICES BY COUNTRY: HISTORICAL DATA (2012–2024)
10. PROFILES OF MAJOR PRODUCERS
The Largest Producers on The Market and Their Profiles
LIST OF TABLES
- Key Findings In 2024
- Market Volume, In Physical Terms: Historical Data (2012–2024) and Forecast (2025–2035)
- Market Value: Historical Data (2012–2024) and Forecast (2025–2035)
- Per Capita Consumption: Historical Data (2012–2024) and Forecast (2025–2035)
- Imports, In Physical Terms, By Country, 2012–2024
- Imports, In Value Terms, By Country, 2012–2024
- Import Prices, By Country, 2012–2024
- Exports, In Physical Terms, By Country, 2012–2024
- Exports, In Value Terms, By Country, 2012–2024
- Export Prices, By Country, 2012–2024
LIST OF FIGURES
- Market Volume, In Physical Terms: Historical Data (2012–2024) and Forecast (2025–2035)
- Market Value: Historical Data (2012–2024) and Forecast (2025–2035)
- Market Structure – Domestic Supply vs. Imports, in Physical Terms: Historical Data (2012–2024) and Forecast (2025–2035)
- Market Structure – Domestic Supply vs. Imports, in Value Terms: Historical Data (2012–2024) and Forecast (2025–2035)
- Trade Balance, In Physical Terms: Historical Data (2012–2024) and Forecast (2025–2035)
- Trade Balance, In Value Terms: Historical Data (2012–2024) and Forecast (2025–2035)
- Per Capita Consumption: Historical Data (2012–2024) and Forecast (2025–2035)
- Market Volume Forecast to 2035
- Market Value Forecast to 2035
- Market Size and Growth, By Product
- Average Per Capita Consumption, By Product
- Exports and Growth, By Product
- Export Prices and Growth, By Product
- Production Volume and Growth
- Exports and Growth
- Export Prices and Growth
- Market Size and Growth
- Per Capita Consumption
- Imports and Growth
- Import Prices
- Production, In Physical Terms: Historical Data (2012–2024) and Forecast (2025–2035)
- Production, In Value Terms: Historical Data (2012–2024) and Forecast (2025–2035)
- Imports, In Physical Terms: Historical Data (2012–2024) and Forecast (2025–2035)
- Imports, In Value Terms: Historical Data (2012–2024) and Forecast (2025–2035)
- Imports, In Physical Terms, By Country, 2024
- Imports, In Physical Terms, By Country, 2012–2024
- Imports, In Value Terms, By Country, 2012–2024
- Import Prices, By Country, 2012–2024
- Exports, In Physical Terms: Historical Data (2012–2024) and Forecast (2025–2035)
- Exports, In Value Terms: Historical Data (2012–2024) and Forecast (2025–2035)
- Exports, In Physical Terms, By Country, 2024
- Exports, In Physical Terms, By Country, 2012–2024
- Exports, In Value Terms, By Country, 2012–2024
- Export Prices, By Country, 2012–2024


