
South Africa - Envelopes - Market Analysis, Forecast, Size, Trends And Insights
Get instant access to more than 2 million reports, dashboards, and datasets on the IndexBox Platform.
View PricingSouth Africa's Envelope Price Hits a Low of $2,797/Ton
South Africa Envelope Export Price in May 2023
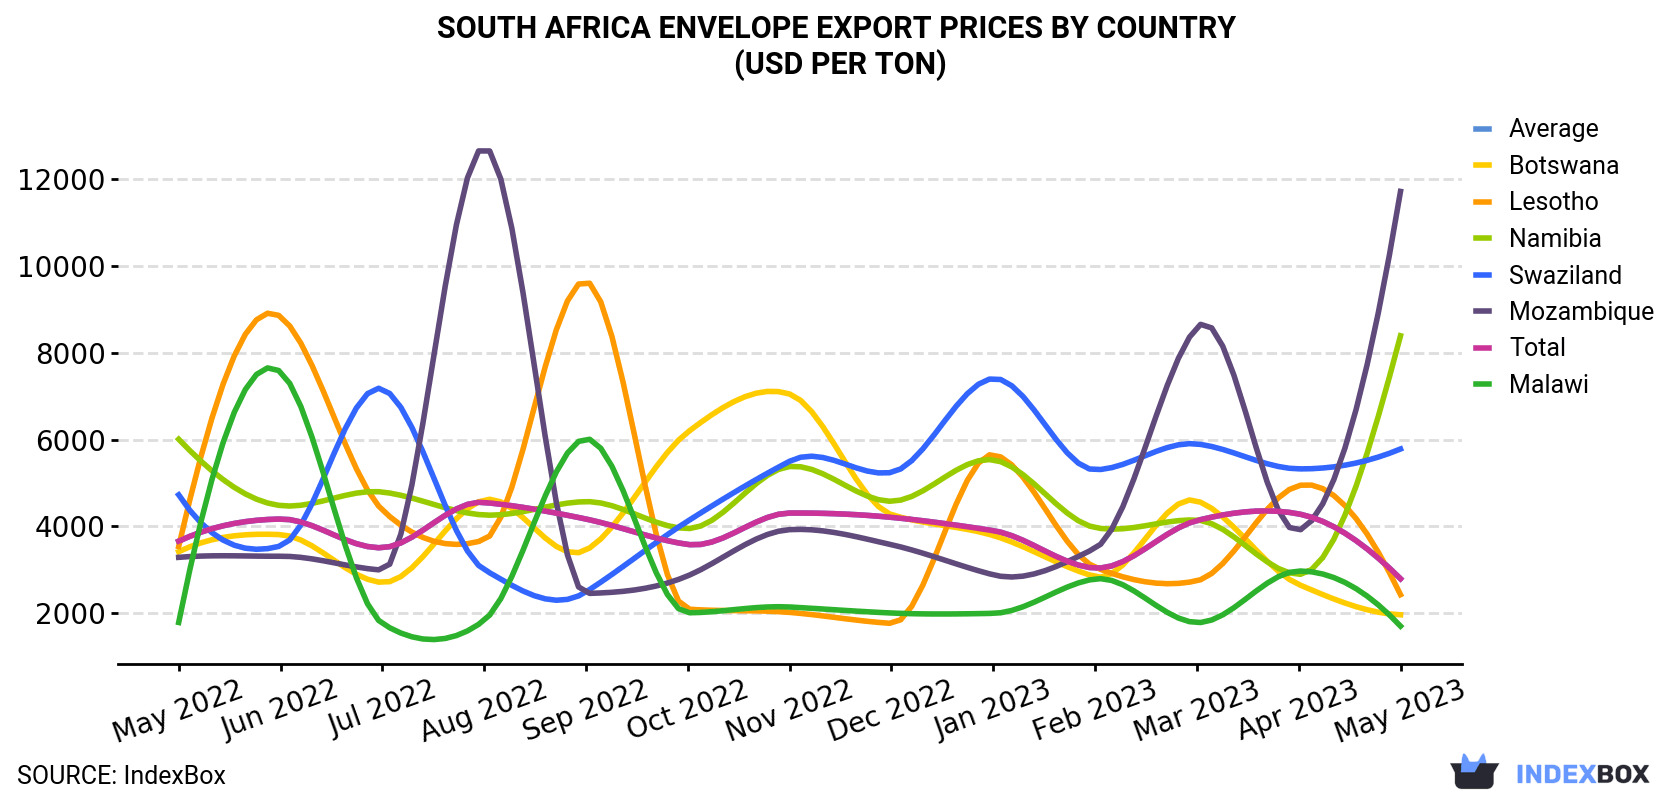
In May 2023, the envelope price amounted to $2,797 per ton (FOB, South Africa), declining by -34.8% against the previous month. Overall, the export price showed a perceptible contraction. The growth pace was the most rapid in March 2023 when the average export price increased by 36% m-o-m. Over the period under review, the average export prices reached the peak figure at $4,554 per ton in August 2022; however, from September 2022 to May 2023, the export prices remained at a lower figure.
Prices varied noticeably by the country of destination: the country with the highest price was Mozambique ($11,713 per ton), while the average price for exports to Malawi ($1,706 per ton) was amongst the lowest.
From May 2022 to May 2023, the most notable rate of growth in terms of prices was recorded for supplies to Mozambique (+11.2%), while the prices for the other major destinations experienced more modest paces of growth.
South Africa Envelope Exports
Envelope exports from South Africa skyrocketed to 50 tons in May 2023, picking up by 63% against April 2023. In general, exports showed a relatively flat trend pattern. The pace of growth was the most pronounced in July 2022 when exports increased by 143% m-o-m. As a result, the exports attained the peak of 68 tons. From August 2022 to May 2023, the growth of the exports remained at a somewhat lower figure.
In value terms, envelope exports totaled $141K (IndexBox estimates) in May 2023. Over the period under review, exports, however, showed a mild decline. The most prominent rate of growth was recorded in July 2022 with an increase of 105% month-to-month. As a result, the exports attained the peak of $238K. From August 2022 to May 2023, the growth of the exports remained at a somewhat lower figure.
South Africa Envelope Exports by Country
Botswana (22 tons), Malawi (12 tons) and Zimbabwe (5.8 tons) were the main destinations of envelope exports from South Africa, together accounting for 80% of total exports. These countries were followed by Zambia, Namibia, Swaziland, Lesotho and Mozambique, which together accounted for a further 20%.
From May 2022 to May 2023, the most notable rate of growth in terms of shipments, amongst the main countries of destination, was attained by Zambia (with a CAGR of +9.0%), while the other leaders experienced more modest paces of growth.
In value terms, the largest markets for envelope exported from South Africa were Botswana ($44K), Zimbabwe ($27K) and Malawi ($21K), with a combined 65% share of total exports.
Zimbabwe, with a CAGR of +5.6%, saw the highest rates of growth with regard to the value of exports, among the main countries of destination over the period under review, while shipments for the other leaders experienced more modest paces of growth.
This report provides an in-depth analysis of the envelope market in South Africa. Within it, you will discover the latest data on market trends and opportunities by country, consumption, production and price developments, as well as the global trade (imports and exports). The forecast exhibits the market prospects through 2030.
Product coverage:
- Prodcom 17231230 - Envelopes of paper or paperboard
Country coverage:
- South Africa
Data coverage:
- Market volume and value
- Per Capita consumption
- Forecast of the market dynamics in the medium term
- Trade (exports and imports) in South Africa
- Export and import prices
- Market trends, drivers and restraints
- Key market players and their profiles
Reasons to buy this report:
- Take advantage of the latest data
- Find deeper insights into current market developments
- Discover vital success factors affecting the market
This report is designed for manufacturers, distributors, importers, and wholesalers, as well as for investors, consultants and advisors.
In this report, you can find information that helps you to make informed decisions on the following issues:
- How to diversify your business and benefit from new market opportunities
- How to load your idle production capacity
- How to boost your sales on overseas markets
- How to increase your profit margins
- How to make your supply chain more sustainable
- How to reduce your production and supply chain costs
- How to outsource production to other countries
- How to prepare your business for global expansion
While doing this research, we combine the accumulated expertise of our analysts and the capabilities of artificial intelligence. The AI-based platform, developed by our data scientists, constitutes the key working tool for business analysts, empowering them to discover deep insights and ideas from the marketing data.
1. INTRODUCTION
Making Data-Driven Decisions to Grow Your Business
- REPORT DESCRIPTION
- RESEARCH METHODOLOGY AND THE AI PLATFORM
- DATA-DRIVEN DECISIONS FOR YOUR BUSINESS
- GLOSSARY AND SPECIFIC TERMS
2. EXECUTIVE SUMMARY
A Quick Overview of Market Performance
- KEY FINDINGS
- MARKET TRENDSThis Chapter is Available Only for the Professional EditionPRO
3. MARKET OVERVIEW
Understanding the Current State of The Market and its Prospects
- MARKET SIZE: HISTORICAL DATA (2012–2024) AND FORECAST (2025–2035)
- MARKET STRUCTURE: HISTORICAL DATA (2012–2024) AND FORECAST (2025–2035)
- TRADE BALANCE: HISTORICAL DATA (2012–2024) AND FORECAST (2025–2035)
- PER CAPITA CONSUMPTION: HISTORICAL DATA (2012–2024) AND FORECAST (2025–2035)
- MARKET FORECAST TO 2035
4. MOST PROMISING PRODUCTS FOR DIVERSIFICATION
Finding New Products to Diversify Your Business
- TOP PRODUCTS TO DIVERSIFY YOUR BUSINESS
- BEST-SELLING PRODUCTS
- MOST CONSUMED PRODUCTS
- MOST TRADED PRODUCTS
- MOST PROFITABLE PRODUCTS FOR EXPORTS
5. MOST PROMISING SUPPLYING COUNTRIES
Choosing the Best Countries to Establish Your Sustainable Supply Chain
- TOP COUNTRIES TO SOURCE YOUR PRODUCT
- TOP PRODUCING COUNTRIES
- TOP EXPORTING COUNTRIES
- LOW-COST EXPORTING COUNTRIES
6. MOST PROMISING OVERSEAS MARKETS
Choosing the Best Countries to Boost Your Export
- TOP OVERSEAS MARKETS FOR EXPORTING YOUR PRODUCT
- TOP CONSUMING MARKETS
- UNSATURATED MARKETS
- TOP IMPORTING MARKETS
- MOST PROFITABLE MARKETS
7. PRODUCTION
The Latest Trends and Insights into The Industry
- PRODUCTION VOLUME AND VALUE: HISTORICAL DATA (2012–2024) AND FORECAST (2025–2035)
8. IMPORTS
The Largest Import Supplying Countries
- IMPORTS: HISTORICAL DATA (2012–2024) AND FORECAST (2025–2035)
- IMPORTS BY COUNTRY: HISTORICAL DATA (2012–2024)
- IMPORT PRICES BY COUNTRY: HISTORICAL DATA (2012–2024)
9. EXPORTS
The Largest Destinations for Exports
- EXPORTS: HISTORICAL DATA (2012–2024) AND FORECAST (2025–2035)
- EXPORTS BY COUNTRY: HISTORICAL DATA (2012–2024)
- EXPORT PRICES BY COUNTRY: HISTORICAL DATA (2012–2024)
10. PROFILES OF MAJOR PRODUCERS
The Largest Producers on The Market and Their Profiles
LIST OF TABLES
- Key Findings In 2024
- Market Volume, In Physical Terms: Historical Data (2012–2024) and Forecast (2025–2035)
- Market Value: Historical Data (2012–2024) and Forecast (2025–2035)
- Per Capita Consumption: Historical Data (2012–2024) and Forecast (2025–2035)
- Imports, In Physical Terms, By Country, 2012–2024
- Imports, In Value Terms, By Country, 2012–2024
- Import Prices, By Country, 2012–2024
- Exports, In Physical Terms, By Country, 2012–2024
- Exports, In Value Terms, By Country, 2012–2024
- Export Prices, By Country, 2012–2024
LIST OF FIGURES
- Market Volume, In Physical Terms: Historical Data (2012–2024) and Forecast (2025–2035)
- Market Value: Historical Data (2012–2024) and Forecast (2025–2035)
- Market Structure – Domestic Supply vs. Imports, in Physical Terms: Historical Data (2012–2024) and Forecast (2025–2035)
- Market Structure – Domestic Supply vs. Imports, in Value Terms: Historical Data (2012–2024) and Forecast (2025–2035)
- Trade Balance, In Physical Terms: Historical Data (2012–2024) and Forecast (2025–2035)
- Trade Balance, In Value Terms: Historical Data (2012–2024) and Forecast (2025–2035)
- Per Capita Consumption: Historical Data (2012–2024) and Forecast (2025–2035)
- Market Volume Forecast to 2035
- Market Value Forecast to 2035
- Market Size and Growth, By Product
- Average Per Capita Consumption, By Product
- Exports and Growth, By Product
- Export Prices and Growth, By Product
- Production Volume and Growth
- Exports and Growth
- Export Prices and Growth
- Market Size and Growth
- Per Capita Consumption
- Imports and Growth
- Import Prices
- Production, In Physical Terms: Historical Data (2012–2024) and Forecast (2025–2035)
- Production, In Value Terms: Historical Data (2012–2024) and Forecast (2025–2035)
- Imports, In Physical Terms: Historical Data (2012–2024) and Forecast (2025–2035)
- Imports, In Value Terms: Historical Data (2012–2024) and Forecast (2025–2035)
- Imports, In Physical Terms, By Country, 2024
- Imports, In Physical Terms, By Country, 2012–2024
- Imports, In Value Terms, By Country, 2012–2024
- Import Prices, By Country, 2012–2024
- Exports, In Physical Terms: Historical Data (2012–2024) and Forecast (2025–2035)
- Exports, In Value Terms: Historical Data (2012–2024) and Forecast (2025–2035)
- Exports, In Physical Terms, By Country, 2024
- Exports, In Physical Terms, By Country, 2012–2024
- Exports, In Value Terms, By Country, 2012–2024
- Export Prices, By Country, 2012–2024


