
Turkey - Heterocyclic Compounds - Market Analysis, Forecast, Size, Trends and Insights
Get instant access to more than 2 million reports, dashboards, and datasets on the IndexBox Platform.
View PricingThe Price of Turkeys Heterocyclic Compound Drops Significantly to $35.8 per kg
Turkey Heterocyclic Compound Import Price in March 2023
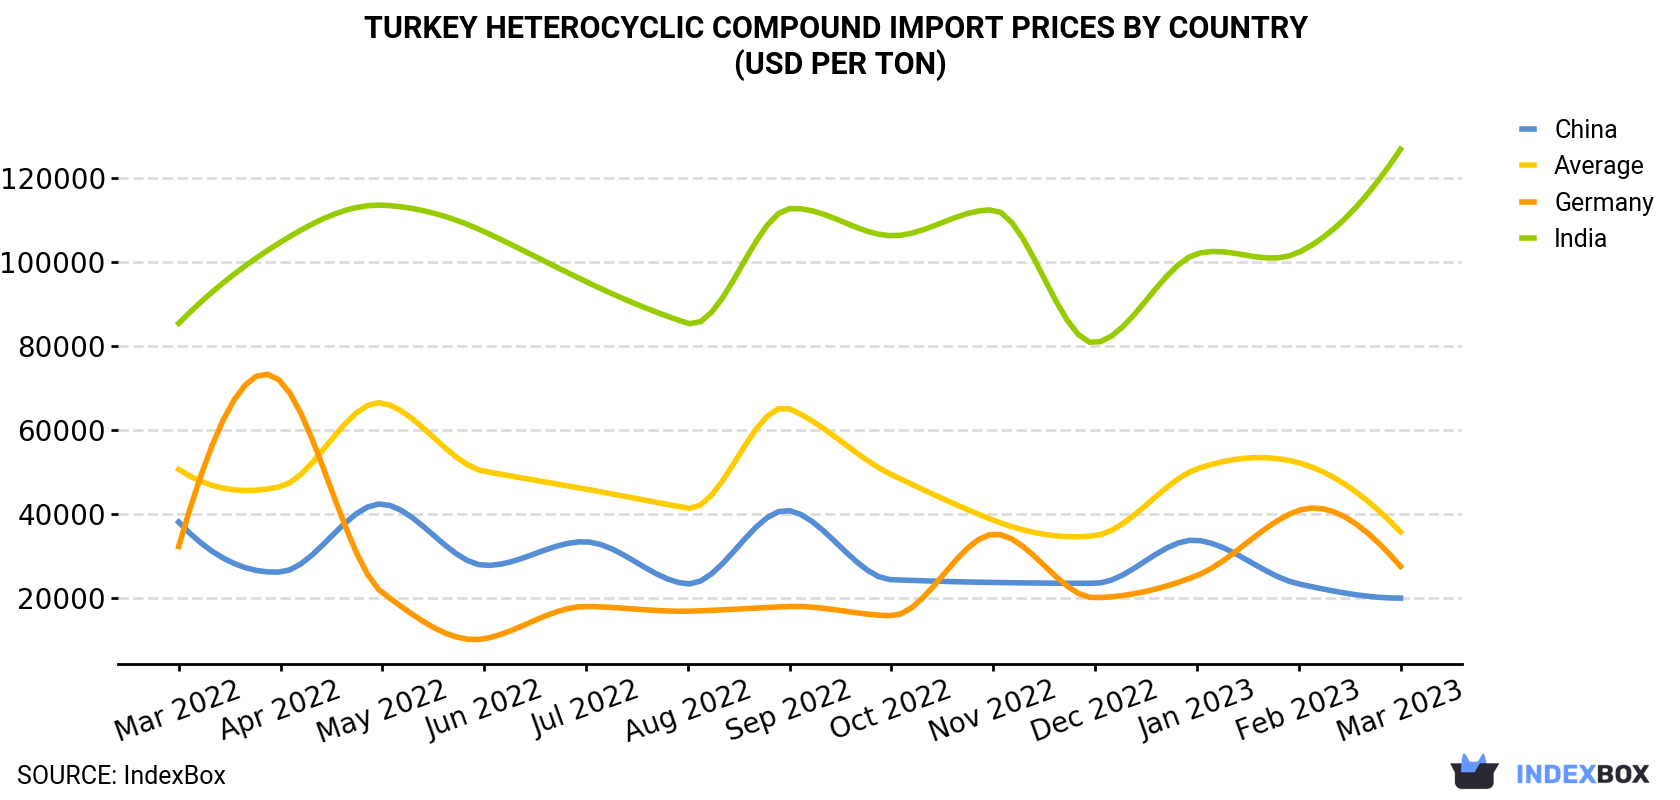
In March 2023, the heterocyclic compound price amounted to $35,776 per ton (CIF, Turkey), reducing by -31.5% against the previous month. In general, the import price recorded a noticeable reduction. The most prominent rate of growth was recorded in September 2022 an increase of 57% against the previous month. Over the period under review, average import prices reached the maximum at $66,479 per ton in May 2022; however, from June 2022 to March 2023, import prices stood at a somewhat lower figure.
Prices varied noticeably by the country of origin: the country with the highest price was India ($127K per ton), while the price for China ($20,012 per ton) was amongst the lowest.
From March 2022 to March 2023, the most notable rate of growth in terms of prices was attained by India (+3.3%), while the prices for the other major suppliers experienced a decline.
| COUNTRY | Import Price of Heterocyclic Compound in Turkey (USD per ton) | ||||||||||||
|---|---|---|---|---|---|---|---|---|---|---|---|---|---|
| Mar 2022 | Apr 2022 | May 2022 | Jun 2022 | Jul 2022 | Aug 2022 | Sep 2022 | Oct 2022 | Nov 2022 | Dec 2022 | Jan 2023 | Feb 2023 | Mar 2023 | |
| India | 85,458 | 104,777 | 113,590 | 107,291 | 95,402 | 85,469 | 112,775 | 106,313 | 112,445 | 80,810 | 102,020 | 102,357 | 126,904 |
| Germany | 32,310 | 71,648 | 21,311 | 10,321 | 18,021 | 16,902 | 18,009 | 15,820 | 35,236 | 20,095 | 25,380 | 40,898 | 27,570 |
| China | 38,126 | 26,230 | 42,420 | 27,811 | 33,430 | 23,396 | 40,838 | 24,398 | 23,737 | 23,542 | 33,792 | 23,390 | 20,012 |
| Average | 50,678 | 46,570 | 66,479 | 50,217 | 45,962 | 41,444 | 65,079 | 49,430 | 38,584 | 34,888 | 50,781 | 52,256 | 35,776 |
Turkey Heterocyclic Compound Import Prices by Type
Prices varied noticeably by the product type; the product with the highest price was heterocyclic compounds; containing an unfused pyridine ring (whether or not hydrogenated) in the structure, other than pyridine and its salts, other than piperidine and its salts ($464K per ton), while the price for heterocyclic compounds; containing an unfused pyridine ring (whether or not hydrogenated) in the structure, other than pyridine and its salts ($35,256 per ton) was amongst the lowest.
From March 2022 to March 2023, the most notable rate of growth in terms of prices was attained by heterocyclic compounds; containing an unfused pyridine ring (whether or not hydrogenated) in the structure, pyridine and its salts (+19.1%), while the prices for the other products experienced mixed trend patterns.
Turkey Heterocyclic Compound Imports
In March 2023, heterocyclic compound imports into Turkey skyrocketed to 342 tons, surging by 52% on the month before. Overall, imports enjoyed a pronounced expansion. The most prominent rate of growth was recorded in November 2022 with an increase of 86% m-o-m.
In value terms, heterocyclic compound imports expanded modestly to $12M (IndexBox estimates) in March 2023. In general, imports showed a relatively flat trend pattern. The pace of growth was the most pronounced in February 2023 with an increase of 74% against the previous month.
Turkey Heterocyclic Compound Imports by Type
In March 2023, heterocyclic compounds; containing an unfused pyridine ring (whether or not hydrogenated) in the structure, other than pyridine and its salts (341 tons) was the main type of heterocyclic compound supplied to Turkey, with a 100% share of total imports. It was followed by heterocyclic compounds; containing an unfused pyridine ring (whether or not hydrogenated) in the structure, other than pyridine and its salts, other than piperidine and its salts (402 kg), with a 0.1% share of total imports. The third position in this ranking was taken by heterocyclic compounds; containing an unfused pyridine ring (whether or not hydrogenated) in the structure, pyridine and its salts (153 kg), with less than 0.1% share.
From March 2022 to March 2023, the average monthly rate of growth in terms of the volume of import of heterocyclic compounds; containing an unfused pyridine ring (whether or not hydrogenated) in the structure, other than pyridine and its salts stood at +3.5%. With regard to the other supplied products, the following average monthly rates of growth were recorded: heterocyclic compounds; containing an unfused pyridine ring (whether or not hydrogenated) in the structure, other than pyridine and its salts, other than piperidine and its salts (-0.7% per month) and heterocyclic compounds; containing an unfused pyridine ring (whether or not hydrogenated) in the structure, pyridine and its salts (-23.4% per month).
In value terms, heterocyclic compounds; containing an unfused pyridine ring (whether or not hydrogenated) in the structure, other than pyridine and its salts ($12M) constituted the largest type of heterocyclic compound supplied to Turkey, comprising 98% of total imports. The second position in the ranking was held by heterocyclic compounds; containing an unfused pyridine ring (whether or not hydrogenated) in the structure, other than pyridine and its salts, other than piperidine and its salts ($187K), with a 1.5% share of total imports. It was followed by heterocyclic compounds; containing an unfused pyridine ring (whether or not hydrogenated) in the structure, pyridine and its salts, with a 0.1% share.
Turkey Heterocyclic Compound Imports by Country
In March 2023, China (263 tons) constituted the largest supplier of heterocyclic compound to Turkey, with a 77% share of total imports. Moreover, heterocyclic compound imports from China exceeded the figures recorded by the second-largest supplier, India (37 tons), sevenfold. Germany (18 tons) ranked third in terms of total imports with a 5.3% share.
From March 2022 to March 2023, the average monthly growth rate of volume from China totaled +5.5%. The remaining supplying countries recorded the following average monthly rates of imports growth: India (-2.0% per month) and Germany (+3.0% per month).
In value terms, China ($5.3M), India ($4.7M) and Germany ($501K) constituted the largest heterocyclic compound suppliers to Turkey, together accounting for 85% of total imports. These countries were followed by Italy, which accounted for a further 2.2%.
Among the main suppliers, Italy, with a CAGR of +2.7%, recorded the highest growth rate of the value of imports, over the period under review, while purchases for the other leaders experienced more modest paces of growth.
This report provides an in-depth analysis of the heterocyclic compound market in Turkey. Within it, you will discover the latest data on market trends and opportunities by country, consumption, production and price developments, as well as the global trade (imports and exports). The forecast exhibits the market prospects through 2030.
Product coverage:
- Prodcom 20145280 -
Country coverage:
- Turkey
Data coverage:
- Market volume and value
- Per Capita consumption
- Forecast of the market dynamics in the medium term
- Trade (exports and imports) in Turkey
- Export and import prices
- Market trends, drivers and restraints
- Key market players and their profiles
Reasons to buy this report:
- Take advantage of the latest data
- Find deeper insights into current market developments
- Discover vital success factors affecting the market
This report is designed for manufacturers, distributors, importers, and wholesalers, as well as for investors, consultants and advisors.
In this report, you can find information that helps you to make informed decisions on the following issues:
- How to diversify your business and benefit from new market opportunities
- How to load your idle production capacity
- How to boost your sales on overseas markets
- How to increase your profit margins
- How to make your supply chain more sustainable
- How to reduce your production and supply chain costs
- How to outsource production to other countries
- How to prepare your business for global expansion
While doing this research, we combine the accumulated expertise of our analysts and the capabilities of artificial intelligence. The AI-based platform, developed by our data scientists, constitutes the key working tool for business analysts, empowering them to discover deep insights and ideas from the marketing data.
1. INTRODUCTION
Making Data-Driven Decisions to Grow Your Business
- REPORT DESCRIPTION
- RESEARCH METHODOLOGY AND THE AI PLATFORM
- DATA-DRIVEN DECISIONS FOR YOUR BUSINESS
- GLOSSARY AND SPECIFIC TERMS
2. EXECUTIVE SUMMARY
A Quick Overview of Market Performance
- KEY FINDINGS
- MARKET TRENDSThis Chapter is Available Only for the Professional EditionPRO
3. MARKET OVERVIEW
Understanding the Current State of The Market and its Prospects
- MARKET SIZE: HISTORICAL DATA (2012–2024) AND FORECAST (2025–2035)
- MARKET STRUCTURE: HISTORICAL DATA (2012–2024) AND FORECAST (2025–2035)
- TRADE BALANCE: HISTORICAL DATA (2012–2024) AND FORECAST (2025–2035)
- PER CAPITA CONSUMPTION: HISTORICAL DATA (2012–2024) AND FORECAST (2025–2035)
- MARKET FORECAST TO 2035
4. MOST PROMISING PRODUCTS FOR DIVERSIFICATION
Finding New Products to Diversify Your Business
- TOP PRODUCTS TO DIVERSIFY YOUR BUSINESS
- BEST-SELLING PRODUCTS
- MOST CONSUMED PRODUCTS
- MOST TRADED PRODUCTS
- MOST PROFITABLE PRODUCTS FOR EXPORTS
5. MOST PROMISING SUPPLYING COUNTRIES
Choosing the Best Countries to Establish Your Sustainable Supply Chain
- TOP COUNTRIES TO SOURCE YOUR PRODUCT
- TOP PRODUCING COUNTRIES
- TOP EXPORTING COUNTRIES
- LOW-COST EXPORTING COUNTRIES
6. MOST PROMISING OVERSEAS MARKETS
Choosing the Best Countries to Boost Your Export
- TOP OVERSEAS MARKETS FOR EXPORTING YOUR PRODUCT
- TOP CONSUMING MARKETS
- UNSATURATED MARKETS
- TOP IMPORTING MARKETS
- MOST PROFITABLE MARKETS
7. PRODUCTION
The Latest Trends and Insights into The Industry
- PRODUCTION VOLUME AND VALUE: HISTORICAL DATA (2012–2024) AND FORECAST (2025–2035)
8. IMPORTS
The Largest Import Supplying Countries
- IMPORTS: HISTORICAL DATA (2012–2024) AND FORECAST (2025–2035)
- IMPORTS BY COUNTRY: HISTORICAL DATA (2012–2024)
- IMPORT PRICES BY COUNTRY: HISTORICAL DATA (2012–2024)
9. EXPORTS
The Largest Destinations for Exports
- EXPORTS: HISTORICAL DATA (2012–2024) AND FORECAST (2025–2035)
- EXPORTS BY COUNTRY: HISTORICAL DATA (2012–2024)
- EXPORT PRICES BY COUNTRY: HISTORICAL DATA (2012–2024)
10. PROFILES OF MAJOR PRODUCERS
The Largest Producers on The Market and Their Profiles
LIST OF TABLES
- Key Findings In 2024
- Market Volume, In Physical Terms: Historical Data (2012–2024) and Forecast (2025–2035)
- Market Value: Historical Data (2012–2024) and Forecast (2025–2035)
- Per Capita Consumption: Historical Data (2012–2024) and Forecast (2025–2035)
- Imports, In Physical Terms, By Country, 2012–2024
- Imports, In Value Terms, By Country, 2012–2024
- Import Prices, By Country, 2012–2024
- Exports, In Physical Terms, By Country, 2012–2024
- Exports, In Value Terms, By Country, 2012–2024
- Export Prices, By Country, 2012–2024
LIST OF FIGURES
- Market Volume, In Physical Terms: Historical Data (2012–2024) and Forecast (2025–2035)
- Market Value: Historical Data (2012–2024) and Forecast (2025–2035)
- Market Structure – Domestic Supply vs. Imports, in Physical Terms: Historical Data (2012–2024) and Forecast (2025–2035)
- Market Structure – Domestic Supply vs. Imports, in Value Terms: Historical Data (2012–2024) and Forecast (2025–2035)
- Trade Balance, In Physical Terms: Historical Data (2012–2024) and Forecast (2025–2035)
- Trade Balance, In Value Terms: Historical Data (2012–2024) and Forecast (2025–2035)
- Per Capita Consumption: Historical Data (2012–2024) and Forecast (2025–2035)
- Market Volume Forecast to 2035
- Market Value Forecast to 2035
- Market Size and Growth, By Product
- Average Per Capita Consumption, By Product
- Exports and Growth, By Product
- Export Prices and Growth, By Product
- Production Volume and Growth
- Exports and Growth
- Export Prices and Growth
- Market Size and Growth
- Per Capita Consumption
- Imports and Growth
- Import Prices
- Production, In Physical Terms: Historical Data (2012–2024) and Forecast (2025–2035)
- Production, In Value Terms: Historical Data (2012–2024) and Forecast (2025–2035)
- Imports, In Physical Terms: Historical Data (2012–2024) and Forecast (2025–2035)
- Imports, In Value Terms: Historical Data (2012–2024) and Forecast (2025–2035)
- Imports, In Physical Terms, By Country, 2024
- Imports, In Physical Terms, By Country, 2012–2024
- Imports, In Value Terms, By Country, 2012–2024
- Import Prices, By Country, 2012–2024
- Exports, In Physical Terms: Historical Data (2012–2024) and Forecast (2025–2035)
- Exports, In Value Terms: Historical Data (2012–2024) and Forecast (2025–2035)
- Exports, In Physical Terms, By Country, 2024
- Exports, In Physical Terms, By Country, 2012–2024
- Exports, In Value Terms, By Country, 2012–2024
- Export Prices, By Country, 2012–2024


