U.S. Snack Food Market. Analysis And Forecast to 2030
Get instant access to more than 2 million reports, dashboards, and datasets on the IndexBox Platform.
View PricingThe Cost of Snack Foods in the United States: $4,442 per Ton
U.S. Snack Food Import Price in June 2023
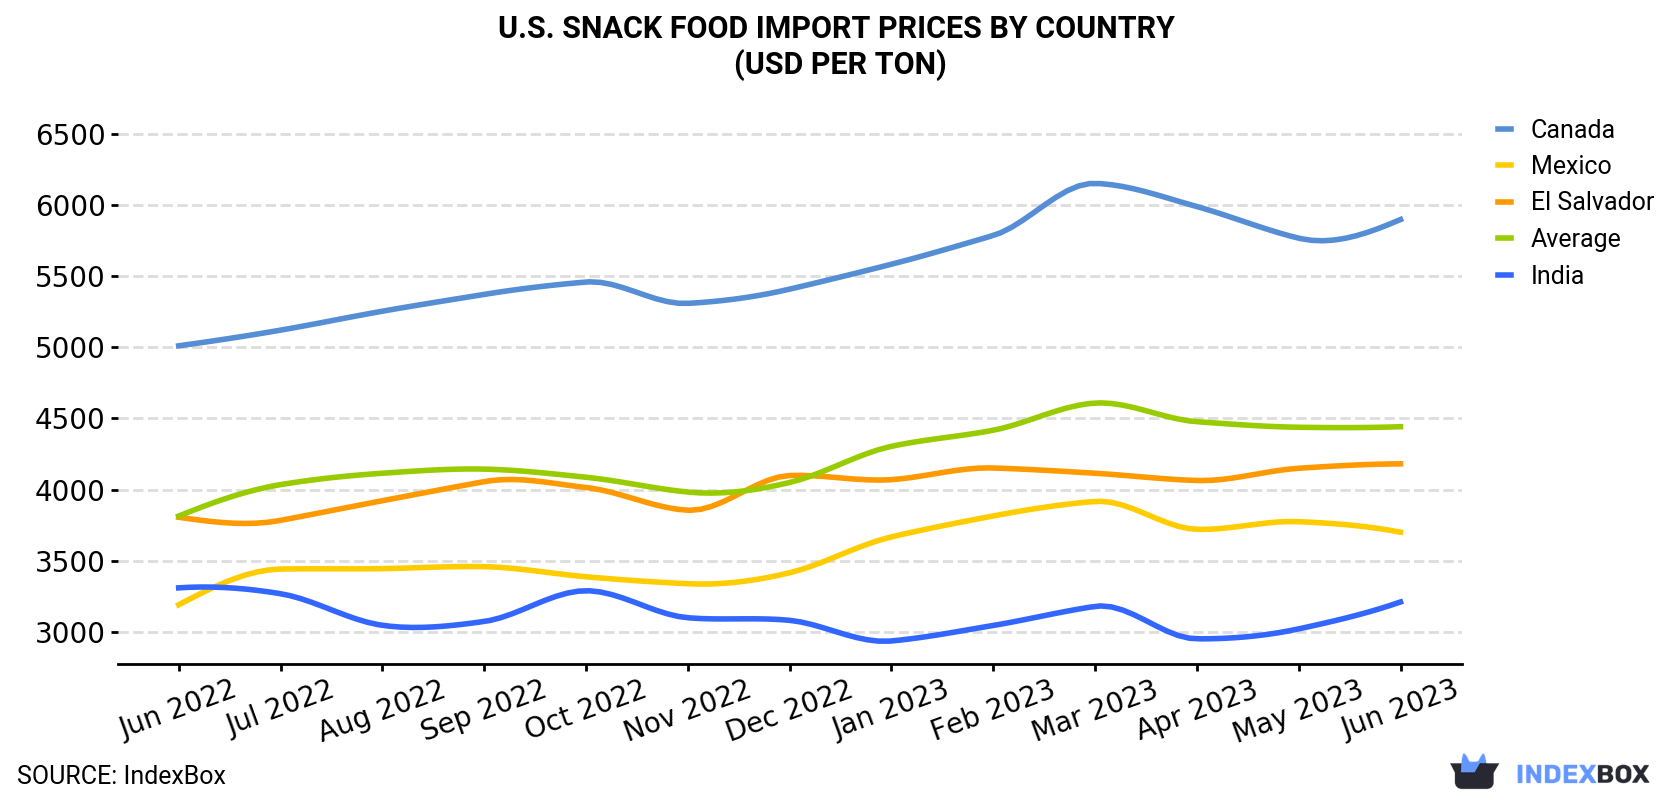
In June 2023, the snack food price stood at $4,442 per ton (CIF, US), remaining relatively unchanged against the previous month. Over the period from June 2022 to June 2023, it increased at an average monthly rate of +1.3%. The pace of growth appeared the most rapid in January 2023 an increase of 6.3% against the previous month. The import price peaked at $4,608 per ton in March 2023; however, from April 2023 to June 2023, import prices failed to regain momentum.
Prices varied noticeably by the country of origin: the country with the highest price was Canada ($5,897 per ton), while the price for India ($3,211 per ton) was amongst the lowest.
From June 2022 to June 2023, the most notable rate of growth in terms of prices was attained by Canada (+1.4%), while the prices for the other major suppliers experienced more modest paces of growth.
| COUNTRY | Import Price of Snack Food in U.S. (USD per ton) | ||||||||||||
|---|---|---|---|---|---|---|---|---|---|---|---|---|---|
| Jun 2022 | Jul 2022 | Aug 2022 | Sep 2022 | Oct 2022 | Nov 2022 | Dec 2022 | Jan 2023 | Feb 2023 | Mar 2023 | Apr 2023 | May 2023 | Jun 2023 | |
| Canada | 5,010 | 5,120 | 5,253 | 5,371 | 5,458 | 5,308 | 5,408 | 5,583 | 5,785 | 6,151 | 5,988 | 5,766 | 5,897 |
| El Salvador | 3,806 | 3,784 | 3,922 | 4,056 | 4,015 | 3,855 | 4,099 | 4,070 | 4,152 | 4,115 | 4,064 | 4,150 | 4,181 |
| Mexico | 3,191 | 3,442 | 3,445 | 3,459 | 3,388 | 3,339 | 3,416 | 3,668 | 3,815 | 3,917 | 3,721 | 3,775 | 3,701 |
| India | 3,310 | 3,269 | 3,047 | 3,074 | 3,290 | 3,100 | 3,082 | 2,937 | 3,046 | 3,180 | 2,952 | 3,022 | 3,211 |
| Average | 3,814 | 4,035 | 4,115 | 4,144 | 4,087 | 3,983 | 4,050 | 4,304 | 4,417 | 4,608 | 4,477 | 4,438 | 4,442 |
U.S. Snack Food Import Prices by Type
U.S. Snack Food Imports
In June 2023, approximately 19K tons of snack food were imported into the United States; reducing by -3% on the month before. Overall, imports, however, recorded a relatively flat trend pattern. The pace of growth appeared the most rapid in May 2023 when imports increased by 19% m-o-m. As a result, imports reached the peak of 19K tons, and then declined in the following month.
In value terms, snack food imports contracted modestly to $83M (IndexBox estimates) in June 2023. The total import value increased at an average monthly rate of +1.4% from June 2022 to June 2023; the trend pattern remained consistent, with somewhat noticeable fluctuations throughout the analyzed period. The most prominent rate of growth was recorded in May 2023 when imports increased by 18% against the previous month. As a result, imports attained the peak of $86M, and then fell slightly in the following month.
U.S. Snack Food Imports by Type
From January 2022 to August 2022, the average monthly rate of growth in terms of the volume of import of No country was relatively modest.
From January 2022 to August 2022, the average monthly rate of growth in terms of the import volume of No country was relatively modest.
U.S. Snack Food Imports by Country
In June 2023, Mexico (11K tons) constituted the largest snack food supplier to the United States, with a 56% share of total imports. Moreover, snack food imports from Mexico exceeded the figures recorded by the second-largest supplier, Canada (4.6K tons), twofold. The third position in this ranking was held by India (620 tons), with a 3.3% share.
From June 2022 to June 2023, the average monthly rate of growth in terms of volume from Mexico was relatively modest. The remaining supplying countries recorded the following average monthly rates of imports growth: Canada (+2.2% per month) and India (+2.0% per month).
In value terms, Mexico ($39M), Canada ($27M) and South Korea ($2.2M) constituted the largest snack food suppliers to the United States, together accounting for 82% of total imports.
South Korea, with a CAGR of +7.2%, recorded the highest growth rate of the value of imports, among the main suppliers over the period under review, while purchases for the other leaders experienced more modest paces of growth.
This report provides an in-depth analysis of the snack food market in the U.S.. Within it, you will discover the latest data on market trends and opportunities by country, consumption, production and price developments, as well as the global trade (imports and exports). The forecast exhibits the market prospects through 2030.
Product coverage:
- NAICS 311919 - Other snack food manufacturing
Companies mentioned:
- Pepsico
- Frito-Lay North America
- Utz Quality Foods
- Herr Foods Incorporated
- Boulder Brands
- Golden Flake Snack Foods
- Barrel O' Fun Snack Foods
- Kettle Foods, Snak-King
- Old Dutch Foods
- Inventure Foods
- S-L Snacks Real Estate
- Wise Foods
- Old Frito-Lay
- Wyandot
- Kln Enterprises
- Pretzels
- Rudolph Foods Company
- J & J Snack Foods Corp. of California
- Rudy's Food Products
- Ideal Snacks Corporation
- Shearer's Foods
- Brookstone Holdings
- Savor Street Foods
- Snack Alliance
- Medallion Foods
- Golden Enterprises
- National Pretzel Company
- Snack Alliance
Country coverage:
- United States
Data coverage:
- Market volume and value
- Per Capita consumption
- Forecast of the market dynamics in the medium term
- Trade (exports and imports) in the U.S.
- Export and import prices
- Market trends, drivers and restraints
- Key market players and their profiles
Reasons to buy this report:
- Take advantage of the latest data
- Find deeper insights into current market developments
- Discover vital success factors affecting the market
This report is designed for manufacturers, distributors, importers, and wholesalers, as well as for investors, consultants and advisors.
In this report, you can find information that helps you to make informed decisions on the following issues:
- How to diversify your business and benefit from new market opportunities
- How to load your idle production capacity
- How to boost your sales on overseas markets
- How to increase your profit margins
- How to make your supply chain more sustainable
- How to reduce your production and supply chain costs
- How to outsource production to other countries
- How to prepare your business for global expansion
While doing this research, we combine the accumulated expertise of our analysts and the capabilities of artificial intelligence. The AI-based platform, developed by our data scientists, constitutes the key working tool for business analysts, empowering them to discover deep insights and ideas from the marketing data.
1. INTRODUCTION
Making Data-Driven Decisions to Grow Your Business
- REPORT DESCRIPTION
- RESEARCH METHODOLOGY AND THE AI PLATFORM
- DATA-DRIVEN DECISIONS FOR YOUR BUSINESS
- GLOSSARY AND SPECIFIC TERMS
2. EXECUTIVE SUMMARY
A Quick Overview of Market Performance
- KEY FINDINGS
- MARKET TRENDSThis Chapter is Available Only for the Professional EditionPRO
3. MARKET OVERVIEW
Understanding the Current State of The Market and its Prospects
- MARKET SIZE: HISTORICAL DATA (2012–2024) AND FORECAST (2025–2035)
- MARKET STRUCTURE: HISTORICAL DATA (2012–2024) AND FORECAST (2025–2035)
- TRADE BALANCE: HISTORICAL DATA (2012–2024) AND FORECAST (2025–2035)
- PER CAPITA CONSUMPTION: HISTORICAL DATA (2012–2024) AND FORECAST (2025–2035)
- MARKET FORECAST TO 2035
4. MOST PROMISING PRODUCTS FOR DIVERSIFICATION
Finding New Products to Diversify Your Business
- TOP PRODUCTS TO DIVERSIFY YOUR BUSINESS
- BEST-SELLING PRODUCTS
- MOST CONSUMED PRODUCTS
- MOST TRADED PRODUCTS
- MOST PROFITABLE PRODUCTS FOR EXPORTS
5. MOST PROMISING SUPPLYING COUNTRIES
Choosing the Best Countries to Establish Your Sustainable Supply Chain
- TOP COUNTRIES TO SOURCE YOUR PRODUCT
- TOP PRODUCING COUNTRIES
- TOP EXPORTING COUNTRIES
- LOW-COST EXPORTING COUNTRIES
6. MOST PROMISING OVERSEAS MARKETS
Choosing the Best Countries to Boost Your Export
- TOP OVERSEAS MARKETS FOR EXPORTING YOUR PRODUCT
- TOP CONSUMING MARKETS
- UNSATURATED MARKETS
- TOP IMPORTING MARKETS
- MOST PROFITABLE MARKETS
7. PRODUCTION
The Latest Trends and Insights into The Industry
- PRODUCTION VOLUME AND VALUE: HISTORICAL DATA (2012–2024) AND FORECAST (2025–2035)
8. IMPORTS
The Largest Import Supplying Countries
- IMPORTS: HISTORICAL DATA (2012–2024) AND FORECAST (2025–2035)
- IMPORTS BY COUNTRY: HISTORICAL DATA (2012–2024)
- IMPORT PRICES BY COUNTRY: HISTORICAL DATA (2012–2024)
9. EXPORTS
The Largest Destinations for Exports
- EXPORTS: HISTORICAL DATA (2012–2024) AND FORECAST (2025–2035)
- EXPORTS BY COUNTRY: HISTORICAL DATA (2012–2024)
- EXPORT PRICES BY COUNTRY: HISTORICAL DATA (2012–2024)
10. PROFILES OF MAJOR PRODUCERS
The Largest Producers on The Market and Their Profiles
LIST OF TABLES
- Key Findings In 2024
- Market Volume, In Physical Terms: Historical Data (2012–2024) and Forecast (2025–2035)
- Market Value: Historical Data (2012–2024) and Forecast (2025–2035)
- Per Capita Consumption: Historical Data (2012–2024) and Forecast (2025–2035)
- Imports, In Physical Terms, By Country, 2012–2024
- Imports, In Value Terms, By Country, 2012–2024
- Import Prices, By Country, 2012–2024
- Exports, In Physical Terms, By Country, 2012–2024
- Exports, In Value Terms, By Country, 2012–2024
- Export Prices, By Country, 2012–2024
LIST OF FIGURES
- Market Volume, In Physical Terms: Historical Data (2012–2024) and Forecast (2025–2035)
- Market Value: Historical Data (2012–2024) and Forecast (2025–2035)
- Market Structure – Domestic Supply vs. Imports, in Physical Terms: Historical Data (2012–2024) and Forecast (2025–2035)
- Market Structure – Domestic Supply vs. Imports, in Value Terms: Historical Data (2012–2024) and Forecast (2025–2035)
- Trade Balance, In Physical Terms: Historical Data (2012–2024) and Forecast (2025–2035)
- Trade Balance, In Value Terms: Historical Data (2012–2024) and Forecast (2025–2035)
- Per Capita Consumption: Historical Data (2012–2024) and Forecast (2025–2035)
- Market Volume Forecast to 2035
- Market Value Forecast to 2035
- Market Size and Growth, By Product
- Average Per Capita Consumption, By Product
- Exports and Growth, By Product
- Export Prices and Growth, By Product
- Production Volume and Growth
- Exports and Growth
- Export Prices and Growth
- Market Size and Growth
- Per Capita Consumption
- Imports and Growth
- Import Prices
- Production, In Physical Terms: Historical Data (2012–2024) and Forecast (2025–2035)
- Production, In Value Terms: Historical Data (2012–2024) and Forecast (2025–2035)
- Imports, In Physical Terms: Historical Data (2012–2024) and Forecast (2025–2035)
- Imports, In Value Terms: Historical Data (2012–2024) and Forecast (2025–2035)
- Imports, In Physical Terms, By Country, 2024
- Imports, In Physical Terms, By Country, 2012–2024
- Imports, In Value Terms, By Country, 2012–2024
- Import Prices, By Country, 2012–2024
- Exports, In Physical Terms: Historical Data (2012–2024) and Forecast (2025–2035)
- Exports, In Value Terms: Historical Data (2012–2024) and Forecast (2025–2035)
- Exports, In Physical Terms, By Country, 2024
- Exports, In Physical Terms, By Country, 2012–2024
- Exports, In Value Terms, By Country, 2012–2024
- Export Prices, By Country, 2012–2024


