Exploring the Top Import Markets for Non-Wheat Flour
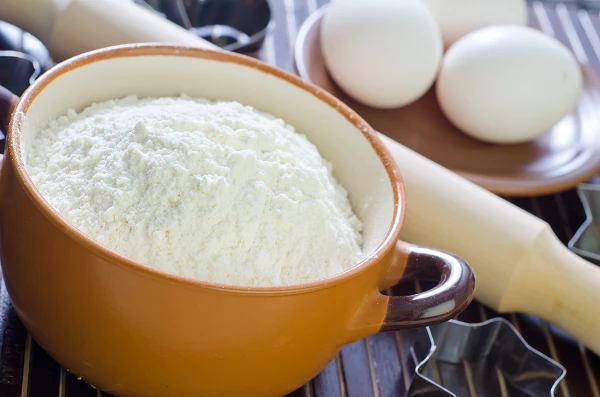
According to the latest data from the IndexBox market intelligence platform, non-wheat flour is a key import commodity in several countries around the world. Non-wheat flour is used in a variety of culinary applications, including gluten-free baking, traditional cooking, and as a thickening agent in soups and sauces. In this article, we will explore the top import markets for non-wheat flour and analyze the key statistics and trends driving these markets.
1. United States
The United States is the world's largest import market for non-wheat flour, with an import value of $327.0 million in 2024. The demand for non-wheat flour in the U.S. is driven by the growing consumer interest in gluten-free and alternative flours for baking and cooking. The country imports non-wheat flour from a variety of sources, including Spain, Canada, and the Netherlands.
2. Spain
Spain is the second-largest import market for non-wheat flour, with an import value of $87.5 million in 2024. The country has a long tradition of using alternative flours in its cuisine, including corn flour, rice flour, and chickpea flour. Spain imports non-wheat flour from countries such as Italy, France, and the United States.
3. Canada
Canada is another significant import market for non-wheat flour, with an import value of $72.8 million in 2024. The country's diverse population has led to a strong demand for alternative flours, including coconut flour, almond flour, and tapioca flour. Canada imports non-wheat flour from countries such as the United States, China, and Thailand.
4. United Kingdom
The United Kingdom is a key import market for non-wheat flour, with an import value of $52.5 million in 2024. The country's thriving gluten-free market has led to a growing demand for alternative flours, such as buckwheat flour, quinoa flour, and teff flour. The United Kingdom imports non-wheat flour from countries such as Italy, Germany, and the Netherlands.
5. Germany
Germany is a significant import market for non-wheat flour, with an import value of $44.4 million in 2024. The country's health-conscious consumers have embraced alternative flours, such as spelt flour, rye flour, and amaranth flour. Germany imports non-wheat flour from countries such as Austria, Poland, and Hungary.
6. Netherlands
The Netherlands is also a key import market for non-wheat flour, with an import value of $44.2 million in 2024. The country's strong baking and culinary tradition has created a demand for a wide range of alternative flours, including sorghum flour, millet flour, and chestnut flour. The Netherlands imports non-wheat flour from countries such as Belgium, France, and Germany.
7. France
France is a significant import market for non-wheat flour, with an import value of $40.8 million in 2024. The country's diverse cuisine and strong culinary culture have led to a demand for a variety of alternative flours, such as buckwheat flour, chestnut flour, and hazelnut flour. France imports non-wheat flour from countries such as Spain, Italy, and Belgium.
8. Democratic Republic of the Congo
The Democratic Republic of the Congo is a growing import market for non-wheat flour, with an import value of $37.3 million in 2024. The country's increasing urbanization and changing dietary habits have created a demand for alternative flours, such as cassava flour, plantain flour, and yam flour. The Democratic Republic of the Congo imports non-wheat flour from countries such as India, China, and Brazil.
9. China
China is an emerging import market for non-wheat flour, with an import value of $32.3 million in 2024. The country's rapidly growing middle class and increasing interest in alternative food products have led to a rising demand for alternative flours, such as coconut flour, almond flour, and soy flour. China imports non-wheat flour from countries such as Thailand, Malaysia, and Indonesia.
10. Malaysia
Malaysia is also a growing import market for non-wheat flour, with an import value of $31.4 million in 2024. The country's diverse population and strong culinary traditions have created a demand for alternative flours, such as tapioca flour, rice flour, and potato flour. Malaysia imports non-wheat flour from countries such as Thailand, Singapore, and Vietnam.
In conclusion, the global market for non-wheat flour is a dynamic and growing sector, driven by changing consumer preferences, health trends, and culinary traditions. The top import markets for non-wheat flour offer significant opportunities for producers and exporters to tap into these markets and meet the increasing demand for alternative flours.
This report provides an in-depth analysis of the global non-wheat flour market. Within it, you will discover the latest data on market trends and opportunities by country, consumption, production and price developments, as well as the global trade (imports and exports). The forecast exhibits the market prospects through 2030.
Product coverage:
- Prodcom 10612200 - Cereal flours (excluding wheat or meslin)
Country coverage:
Worldwide - the report contains statistical data for 200 countries and includes detailed profiles of the 50 largest consuming countries:
- USA
- China
- Japan
- Germany
- United Kingdom
- France
- Brazil
- Italy
- Russian Federation
- India
- Canada
- Australia
- Republic of Korea
- Spain
- Mexico
- Indonesia
- Netherlands
- Turkey
- Saudi Arabia
- Switzerland
- Sweden
- Nigeria
- Poland
- Belgium
- Argentina
- Norway
- Austria
- Thailand
- United Arab Emirates
- Colombia
- Denmark
- South Africa
- Malaysia
- Israel
- Singapore
- Egypt
- Philippines
- Finland
- Chile
- Ireland
- Pakistan
- Greece
- Portugal
- Kazakhstan
- Algeria
- Czech Republic
- Qatar
- Peru
- Romania
- Vietnam
+ the largest producing countries
Data coverage:
- Global market volume and value
- Per Capita consumption
- Forecast of the market dynamics in the medium term
- Global production, split by region and country
- Global trade (exports and imports)
- Export and import prices
- Market trends, drivers and restraints
- Key market players and their profiles
Reasons to buy this report:
- Take advantage of the latest data
- Find deeper insights into current market developments
- Discover vital success factors affecting the market
This report is designed for manufacturers, distributors, importers, and wholesalers, as well as for investors, consultants and advisors.
In this report, you can find information that helps you to make informed decisions on the following issues:
- How to diversify your business and benefit from new market opportunities
- How to load your idle production capacity
- How to boost your sales on overseas markets
- How to increase your profit margins
- How to make your supply chain more sustainable
- How to reduce your production and supply chain costs
- How to outsource production to other countries
- How to prepare your business for global expansion
While doing this research, we combine the accumulated expertise of our analysts and the capabilities of artificial intelligence. The AI-based platform, developed by our data scientists, constitutes the key working tool for business analysts, empowering them to discover deep insights and ideas from the marketing data.
1. INTRODUCTION
Making Data-Driven Decisions to Grow Your Business
- REPORT DESCRIPTION
- RESEARCH METHODOLOGY AND THE AI PLATFORM
- DATA-DRIVEN DECISIONS FOR YOUR BUSINESS
- GLOSSARY AND SPECIFIC TERMS
2. EXECUTIVE SUMMARY
A Quick Overview of Market Performance
- KEY FINDINGS
- MARKET TRENDS This Chapter is Available Only for the Professional EditionPRO
3. MARKET OVERVIEW
Understanding the Current State of The Market and its Prospects
- MARKET SIZE: HISTORICAL DATA (2012–2024) AND FORECAST (2025–2035)
- CONSUMPTION BY COUNTRY: HISTORICAL DATA (2012–2024) AND FORECAST (2025–2035)
- MARKET FORECAST TO 2035
4. MOST PROMISING PRODUCTS FOR DIVERSIFICATION
Finding New Products to Diversify Your Business
- TOP PRODUCTS TO DIVERSIFY YOUR BUSINESS
- BEST-SELLING PRODUCTS
- MOST CONSUMED PRODUCTS
- MOST TRADED PRODUCTS
- MOST PROFITABLE PRODUCTS FOR EXPORT
5. MOST PROMISING SUPPLYING COUNTRIES
Choosing the Best Countries to Establish Your Sustainable Supply Chain
- TOP COUNTRIES TO SOURCE YOUR PRODUCT
- TOP PRODUCING COUNTRIES
- TOP EXPORTING COUNTRIES
- LOW-COST EXPORTING COUNTRIES
6. MOST PROMISING OVERSEAS MARKETS
Choosing the Best Countries to Boost Your Export
- TOP OVERSEAS MARKETS FOR EXPORTING YOUR PRODUCT
- TOP CONSUMING MARKETS
- UNSATURATED MARKETS
- TOP IMPORTING MARKETS
- MOST PROFITABLE MARKETS
7. PRODUCTION
The Latest Trends and Insights into The Industry
- PRODUCTION VOLUME AND VALUE: HISTORICAL DATA (2012–2024) AND FORECAST (2025–2035)
- PRODUCTION BY COUNTRY: HISTORICAL DATA (2012–2024) AND FORECAST (2025–2035)
8. IMPORTS
The Largest Import Supplying Countries
- IMPORTS: HISTORICAL DATA (2012–2024) AND FORECAST (2025–2035)
- IMPORTS BY COUNTRY: HISTORICAL DATA (2012–2024) AND FORECAST (2025–2035)
- IMPORT PRICES BY COUNTRY: HISTORICAL DATA (2012–2024) AND FORECAST (2025–2035)
9. EXPORTS
The Largest Destinations for Exports
- EXPORTS: HISTORICAL DATA (2012–2024) AND FORECAST (2025–2035)
- EXPORTS BY COUNTRY: HISTORICAL DATA (2012–2024) AND FORECAST (2025–2035)
- EXPORT PRICES BY COUNTRY: HISTORICAL DATA (2012–2024) AND FORECAST (2025–2035)
10. PROFILES OF MAJOR PRODUCERS
The Largest Producers on The Market and Their Profiles
-
11. COUNTRY PROFILES
The Largest Markets And Their Profiles
This Chapter is Available Only for the Professional Edition PRO- United States
- China
- Japan
- Germany
- United Kingdom
- France
- Brazil
- Italy
- Russian Federation
- India
- Canada
- Australia
- Republic of Korea
- Spain
- Mexico
- Indonesia
- Netherlands
- Turkey
- Saudi Arabia
- Switzerland
- Sweden
- Nigeria
- Poland
- Belgium
- Argentina
- Norway
- Austria
- Thailand
- United Arab Emirates
- Colombia
- Denmark
- South Africa
- Malaysia
- Israel
- Singapore
- Egypt
- Philippines
- Finland
- Chile
- Ireland
- Pakistan
- Greece
- Portugal
- Kazakhstan
- Algeria
- Czech Republic
- Qatar
- Peru
- Romania
- Vietnam
LIST OF TABLES
- Key Findings In 2024
- Market Volume, In Physical Terms: Historical Data (2012–2024) and Forecast (2025–2035)
- Market Value: Historical Data (2012–2024) and Forecast (2025–2035)
- Per Capita Consumption, by Country, 2022–2024
- Production, In Physical Terms, By Country: Historical Data (2012–2024) and Forecast (2025–2035)
- Imports, In Physical Terms, By Country: Historical Data (2012–2024) and Forecast (2025–2035)
- Imports, In Value Terms, By Country: Historical Data (2012–2024) and Forecast (2025–2035)
- Import Prices, By Country: Historical Data (2012–2024) and Forecast (2025–2035)
- Exports, In Physical Terms, By Country: Historical Data (2012–2024) and Forecast (2025–2035)
- Exports, In Value Terms, By Country: Historical Data (2012–2024) and Forecast (2025–2035)
- Export Prices, By Country: Historical Data (2012–2024) and Forecast (2025–2035)
LIST OF FIGURES
- Market Volume, In Physical Terms: Historical Data (2012–2024) and Forecast (2025–2035)
- Market Value: Historical Data (2012–2024) and Forecast (2025–2035)
- Consumption, by Country, 2024
- Market Volume Forecast to 2035
- Market Value Forecast to 2035
- Market Size and Growth, By Product
- Average Per Capita Consumption, By Product
- Exports and Growth, By Product
- Export Prices and Growth, By Product
- Production Volume and Growth
- Exports and Growth
- Export Prices and Growth
- Market Size and Growth
- Per Capita Consumption
- Imports and Growth
- Import Prices
- Production, In Physical Terms: Historical Data (2012–2024) and Forecast (2025–2035)
- Production, In Value Terms: Historical Data (2012–2024) and Forecast (2025–2035)
- Production, by Country, 2024
- Production, In Physical Terms, by Country: Historical Data (2012–2024) and Forecast (2025–2035)
- Imports, In Physical Terms: Historical Data (2012–2024) and Forecast (2025–2035)
- Imports, In Value Terms: Historical Data (2012–2024) and Forecast (2025–2035)
- Imports, In Physical Terms, By Country, 2024
- Imports, In Physical Terms, By Country: Historical Data (2012–2024) and Forecast (2025–2035)
- Imports, In Value Terms, By Country: Historical Data (2012–2024) and Forecast (2025–2035)
- Import Prices, By Country: Historical Data (2012–2024) and Forecast (2025–2035)
- Exports, In Physical Terms: Historical Data (2012–2024) and Forecast (2025–2035)
- Exports, In Value Terms: Historical Data (2012–2024) and Forecast (2025–2035)
- Exports, In Physical Terms, By Country, 2024
- Exports, In Physical Terms, By Country: Historical Data (2012–2024) and Forecast (2025–2035)
- Exports, In Value Terms, By Country: Historical Data (2012–2024) and Forecast (2025–2035)
- Export Prices, By Country: Historical Data (2012–2024) and Forecast (2025–2035)


